Visualisation
Showing query results as tables in a document only works up to a certain extent. When you want to display large datasets or data evolving over time, a chart or graph may offer better insight.
So we searched the internet to find the right tool that would quickly offer us the ability to create visual enhanced insight. A lot of tooling is available, but few of them are open source, which is one of the requirements we had. We also wanted to be as "cross-platform" as possible, a tool that can run in a browser would be great.
We settled with Metabase, the software version used in this document is Metabase v0.46.5, built on 2023-06-14.
Docker
The only requirement for Metabase is Docker which is available for Windows, Linux and Mac. You can follow the download and install instructions from the website.
Run Metabase
Once Docker is installed, Metabase can be started by running:
docker run -d -p 3000:3000 --name metabase metabase/metabase
This is the default way of installing the open source edition as described on the Metabase website (https://www.metabase.com/start/oss). After running the previous command, point the browser to http://localhost:3000, set up a username and password and connect to the postgresql database directly.
When you open the webpage, you will be greeted by a welcome screen. This screen will show a Let's get started button at first use.
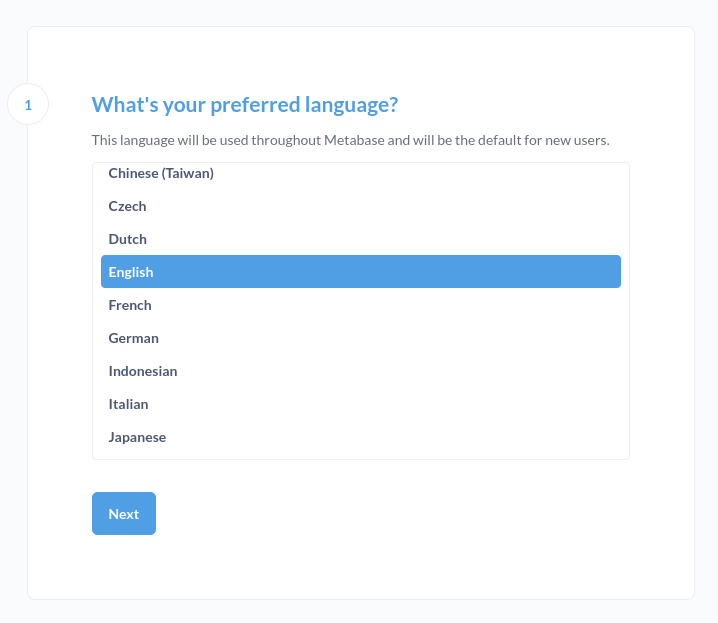
After pressing the button, you will be prompted to select your language. We select English.
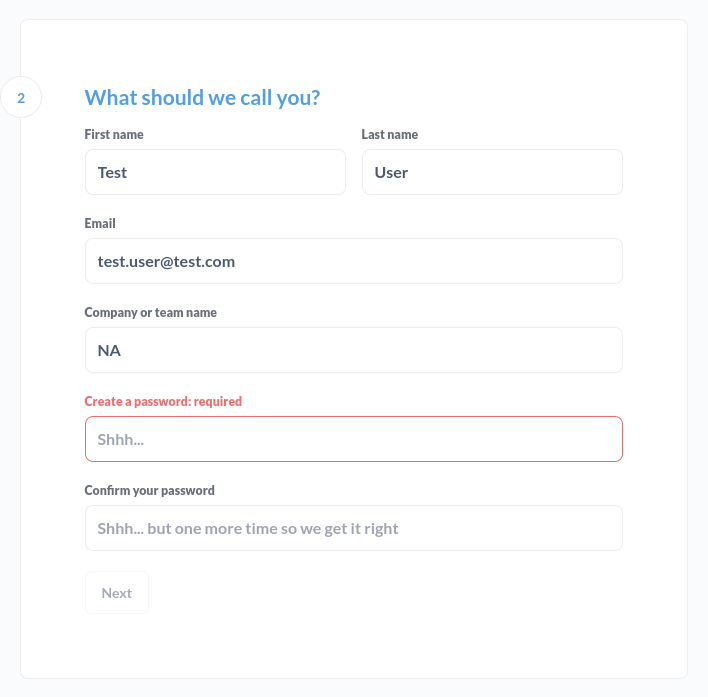
Next, you need to set up a user account. This account will be local to your installation, so don't worry about what you enter here, as long as you remember the email address you use and the password.
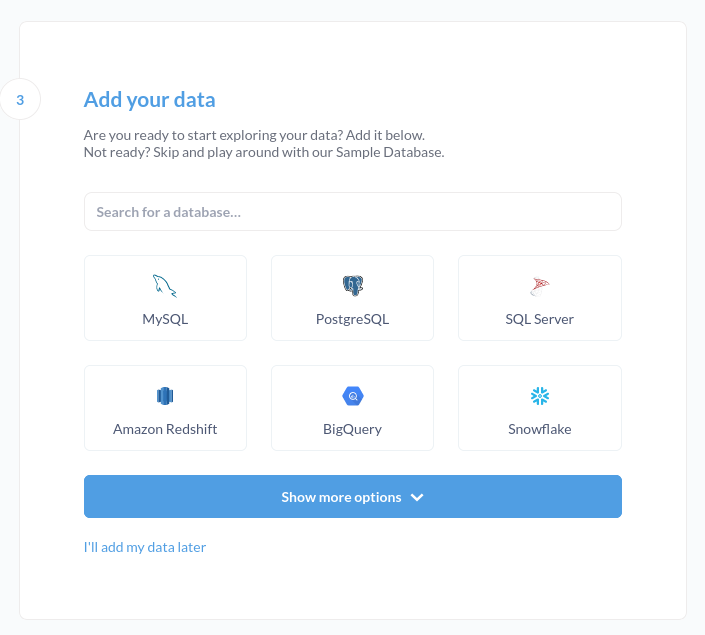
Then you need the to select a Database type, in our case this will be PostgreSQL, the option with the blue elephant.
Because Metabase runs isolated, you cannot use localhost as a host. Make sure you enter the right credentials and select the ip-address to your computer.
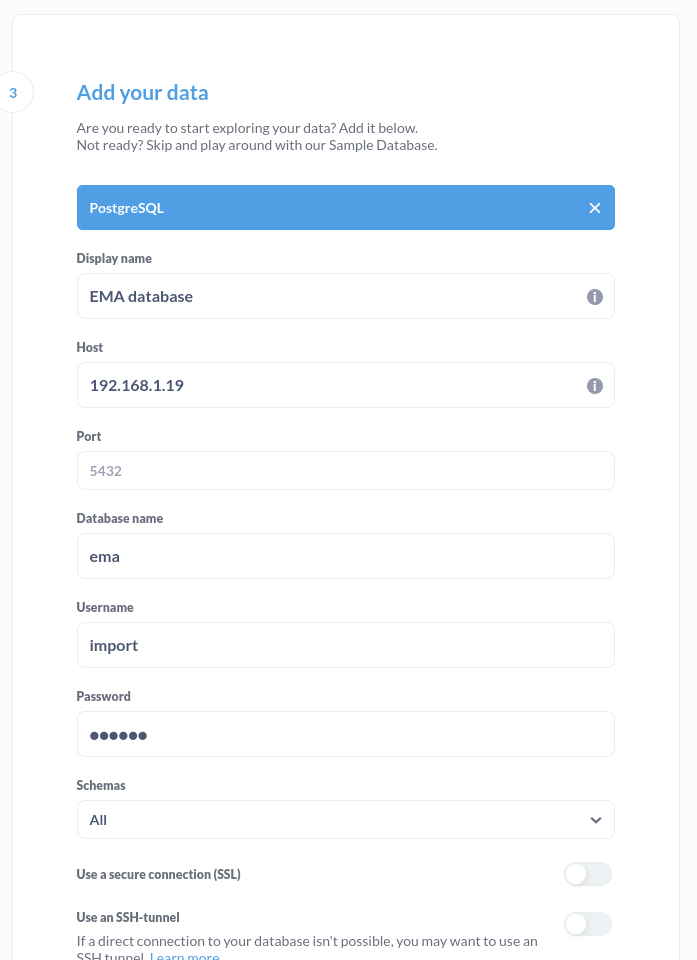
When finished, press the Connect database button.
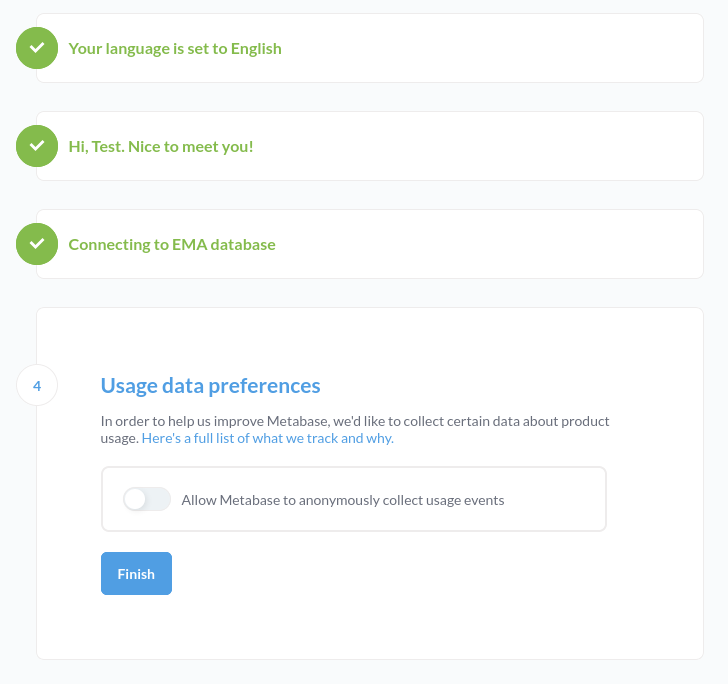
If all went well, you should see Step 4 showing a Finish button. We decided to disallow Metabase to anonymously collect usage events.
You can then decide to sign up for a the Metabase newsletter, but we skip it and press the Take me to Metabase button.
If all went well, you should have a Metabase dashboard like the next picture. You can press the buttons in the dashboard to get some general insights into our database.
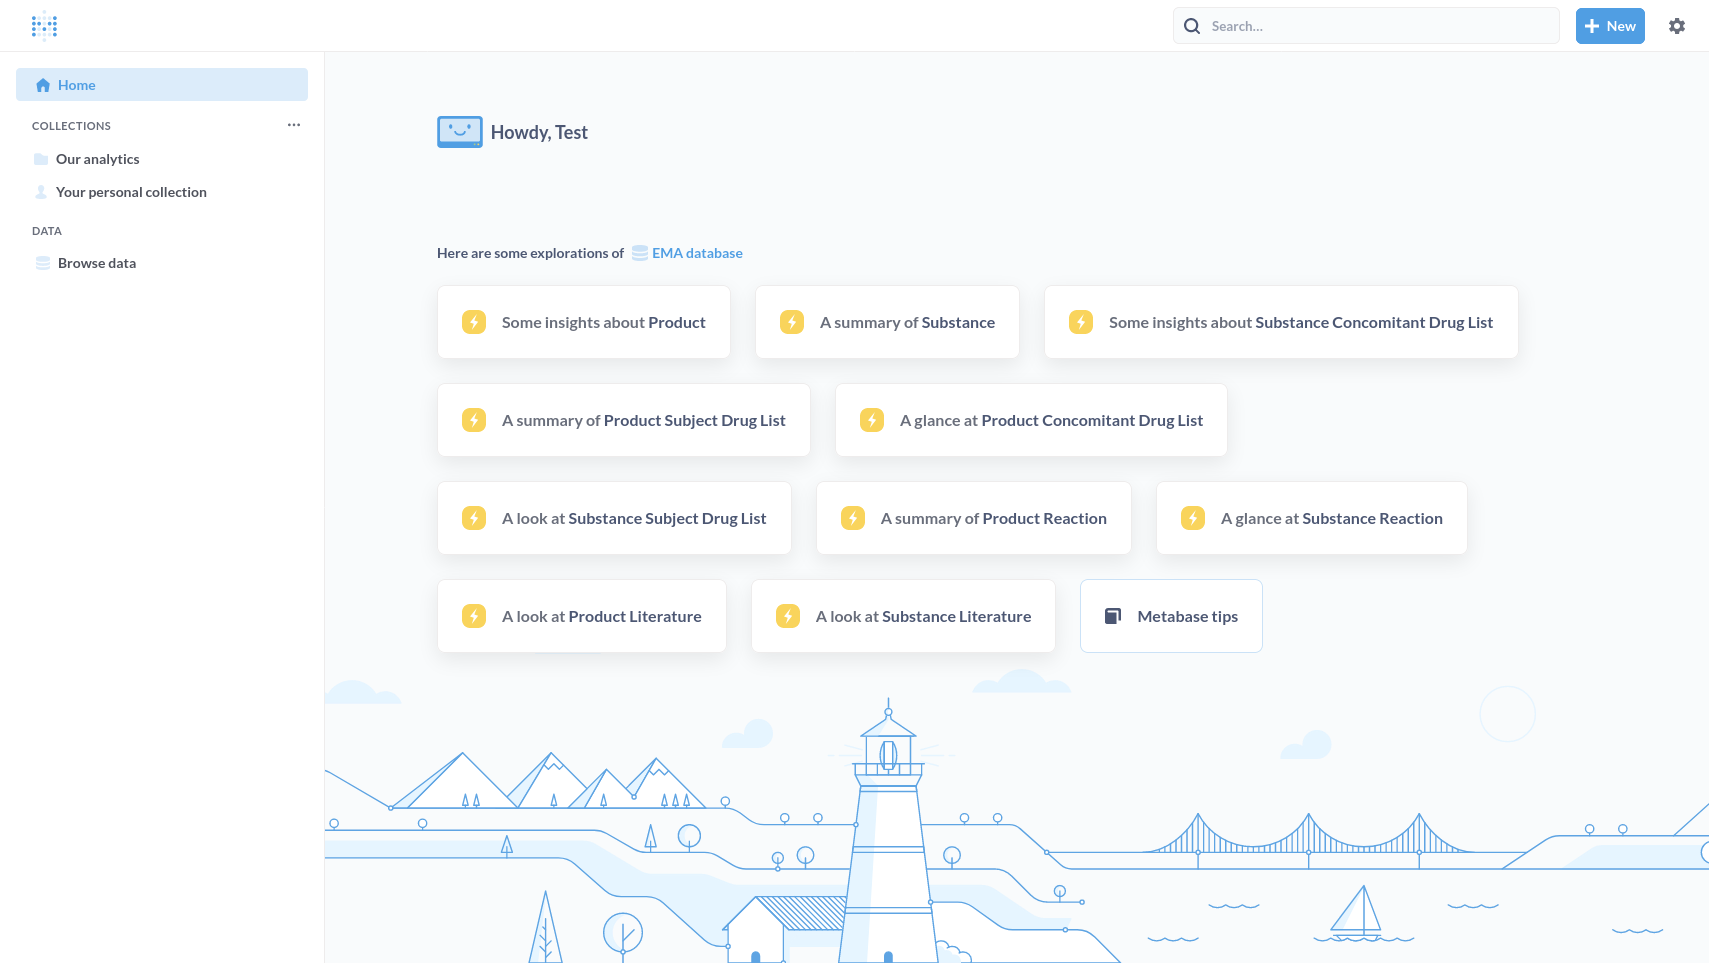
The Metabase dashboard will be used throughout the visualisation chapter. More information on Metabase can be found in the Documentation section of the Metabase website
Add the map of Europe
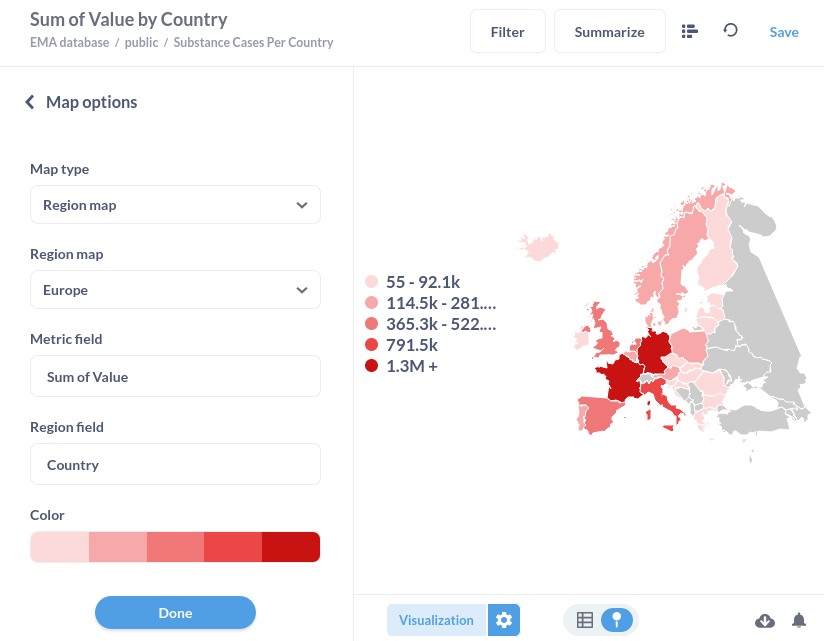
If you want to visualise data on a map, you can use this Map of Europe with which it is possible to attach the country field from the tables in the public namespace as shown in the example below.
