Introduction
The European Medicines Agency (EMA) is a decentralised agency of the European Union (EU). EMA hosts a system called EudraVigilance used for managing and analysing information on suspected adverse reactions to medicines.
A restricted set of data elements in EudraVigilance is available and provided to healthcare professionals, patients and the general public. To allow for a more user friendly experience OpenEMA downloaded the data.
OpenEMA is a PRIVATE entity, not affiliated with EMA. In this documentation we describe how data was downloaded from EMA and subsequently put in a database. We then show example analyses that were run against the database using Standard Query Language (SQL). Finally we create visualisations for data and trends using the open source version of Metabase.
For example; the top-10 reported substances represented in a bar chart.

Or substance reactions visualised in a line graph.
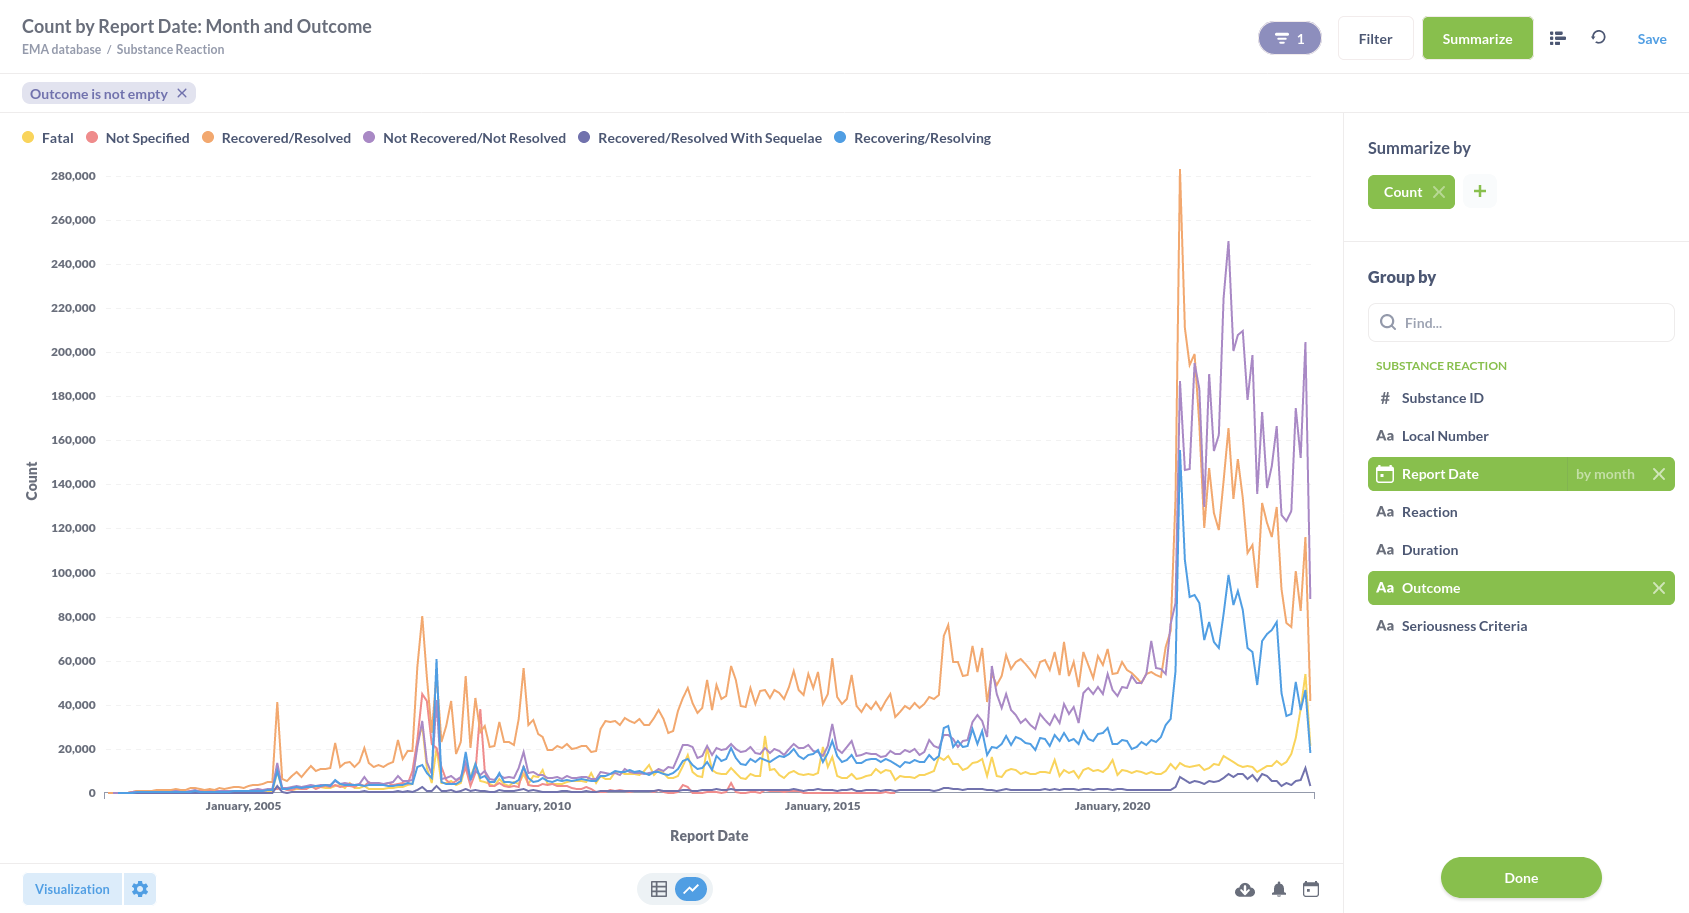
This project is meant to share the data and help you, our audience, to reproduce our examples and kickstart a community of amateur and professional (data) scientists to use this database and inform each other and other professionals and the public on what information is available and what the information can tell us.
About the data
We downloaded line listings for Individual Case Safety Reports (ICSR, shortened throughout this documentation as report) and processed them into a PostgreSQL database. PostgreSQL can be queries with SQL that enables users to ask questions such as "Select the sum of all records from a table of data where column X has a date value of Y". PostgreSQL has a beginner tutorial available that explains the possibilities of using SQL.
Community
We strongly encourage everyone to share ideas and insights and open a broad discussion on the value of the EMA Eudravigilance data and the information available within the data. We welcome everyone to the OpenEMA community.
To enable this goal, the data and this documentation is made available under the CC-BY-NC-SA license.
Keep in mind, the examples are just that, examples. They can (and will) contain (minor) errors due to the fact that reports spanning multiple products or substances are not always correctly queried in the examples. We can use help to make sure the examples are checked, validated and corrected where necessary.
This documentation
The documentation is maintained with mdbook. The source code for this website is on gitlab.
Pre-compiled binaries
Executable binaries are available for download on the GitHub Releases page. Download the binary for your platform (Windows, macOS, or Linux) and extract the archive. The archive contains an mdbook executable which you can run to build your books.
To make it easier to run, put the path to the binary into your PATH.
Serve
You can run the documentation as a website using:
mdbook serve -p 3001 --open
Database
We use PostgreSQL as database.
How we get line listings
Line listings are "The data and information provided at substance level is in the form of an electronic Reaction Monitoring Report (eRMR) containing aggregated data and a line listing with details of the individual cases." (see: glossary).
At first, we started to follow the links in the internet pages and clicked every download individually. We then renamed all downloaded files and used automated routines to process them into a database for further investigation. The processing of the files became easy, but the downloading of them resulted in a lot of manual labour. We discovered that because of the large number of available ICSR’s, this would probably take years.
So we took a good look using the web browsers “development tools” to see what data was being processed by the javascript functions in the various web pages. This lead to the discovery of the link that produces line listing files at the url https://dap.ema.europa.eu/analytics/saw.dll?Go where we detected that a set of variables was constantly changing as per individual substance or product using a set of query parameters in a HTTP GET request. We then set out to directly call this url with the parameters for substance or products. This seemed to work but a lot of files we downloaded seemed broken and contained warnings in javascript/html when we inspected them.
The error reported was often that a maximum number of records was reached or a timeout took place. So we wanted to find a way to download smaller line listings which would not generate an error. To achieve this, we inspected the query parameters available and tested various ways of setting or unsetting them. We managed to use some to filter the result, f.i. we could download a single year by setting a parameter "Line Listing Objects”.”Gateway Year” “eq” “2020” which indeed resulted in records for the year of 2020 only. We kept at this until we had defined a couple of interchangeable filters that where usable for both product and substance line listings and made sure we stayed within the maximum number of records. Our scripts, written in python version 3, is able to download line listings as they are available via the portal using the filter options (which are also available through the portal as select options in visual
elements) for further automated processing on a personal computer.
We used two different scripts for the download.
- One script that parses the web pages that show maps/tables giving information about the number of cases per product or substance per country. This script generated the CSV files available in the file
EMA-countries-2023-06-20.zipthese files where uploaded into the database’s public schema as the tablespublic.substance_cases_per_countryandpublic.product_cases_per_country. - Another script parsed the webpages that generate “line listings” resulting in CSV files containing detailed information about ICSR’s. The result are the files available in the files
EMA-products-2023-06-20.zipandEMA-substances-2023-06-20.zip.
All scripts are written in python version 3 and available on request. We chose not to disclose the scripts used for downloading line listings publicly, but on request to make sure people running these scripts know what they are doing as we do not want to stress the EMA web application.
Import line listings
Now that all files where downloaded and we where sure they contained no errors, We decided to import them into a PostgreSQL database in order to make the data from the reports available for further, detailed analyses. We wrote a python version 3 script with various routines to perform checks and migrate data into a relational structure. In the script we made sure that all data except the links to the website would be processed and would end up in the database. For convenience, all data retrieved from the downloaded files was put in a schema called “import” in the database. The database schema contains 2 general tables; import.products and import.substances that contain the product or substance code followed by a product or substance name. As the CSV files only contain codes, we can later use these tables to get the “human readable name” of products or substances. The import.substance and import.product tables contain the individual reports where the codes for the product or the substance have been added in the process, plus an indicator about the “seriousness” as this is a filter parameter that was available while requesting the line listings, but was not available in the resulting CSV file. The CSV field for reaction has been split in individual records resulting in the table import.substance_reaction and import.product_reaction. We used a similar splitting process to create the tables import.substance_subject drug_list, import.product_subject_drug_list and import.substance_concomitant_drug_list, import.product_concomitant_drug_list and import.substance_literature and import.product_literature resulting in rows containing references that can later be used for further research but have not been processed further in any of our examples. With the script that created the database, we managed to store all information available from the CSV files in the database. From this database we generated the file ema.dump using the following command:
pg_dump -Fc -Z 9 -U superset --file=~/ema.dump ema
from this dump, a database can be constructed using:
pg_restore -U postgres -Fc -j 8 --no-owner -d ema ~/ema.dump
this will take between 2 and 15 minutes depending on the speed of your computer and the settings of postgresql
More information and instructions on installing a database can be found on the PostgreSQL documentation website in particular the documentation on pg_dump and pg_restore.
Source code for importing line listings
The script that copies the content of the CSV files into the PostgreSQL database is called the OpenEma CSV reader for which you can view and download the required source files from the GitLab repository. If you are a software developer and/or are interested in checking python version 3 code, we welcome you to check the source code and help us detect any mistakes.
Clean
After importing the line listings there are duplicate records in the database in various tables. The following SQL script makes sure all tables in the import schema contained unique reports and supporting tables only.
Remove duplicates from substance
CREATE TABLE import.substance_unique AS
SELECT
  substance_id,
  local_number,
  report_type,
  report_date,
  qualification,
  country,
  age_group_lower_months,
  age_group_upper_months,
  age_group_reporter,
  is_child_report,
  sex,
  serious
FROM import.substance GROUP BY
  substance_id,
  local_number,
  report_type,
  report_date,
  qualification,
  country,
  age_group_lower_months,
  age_group_upper_months,
  age_group_reporter,
  is_child_report,
  sex,
  serious;

DROP TABLE import.substance;

ALTER TABLE import.substance_unique
  RENAME TO substance;
Remove duplicates from substance_concomitant_drug_list
CREATE TABLE import.substance_concomitant_drug_list_unique AS
SELECT
  substance_id,
  local_number,
  report_date,
  drugs,
  characteristic,
  indication,
  action,
  duration,
  dose,
  route
FROM import.substance_concomitant_drug_list GROUP BY
  substance_id,
  local_number,
  report_date,
  drugs,
  characteristic,
  indication,
  action,
  duration,
  dose,
  route;
DROP TABLE import.substance_concomitant_drug_list;

ALTER TABLE import.substance_concomitant_drug_list_unique
  RENAME TO substance_concomitant_drug_list;
Remove duplicates from substance_subject_drug_list
CREATE TABLE import.substance_subject_drug_list_unique AS
SELECT
  substance_id,
  local_number,
  report_date,
  drugs,
  characteristic,
  indication,
  action,
  duration,
  dose,
  route
FROM import.substance_subject_drug_list GROUP BY
  substance_id,
  local_number,
  report_date,
  drugs,
  characteristic,
  indication,
  action,
  duration,
  dose,
  route;

DROP TABLE import.substance_subject_drug_list;

ALTER TABLE import.substance_subject_drug_list_unique
  RENAME TO substance_subject_drug_list;
Remove duplicates from substance_reaction
CREATE TABLE import.substance_reaction_unique AS
SELECT
  substance_id,
  local_number,
  report_date,
  reaction,
  duration,
  outcome,
  seriousness_criteria
FROM import.substance_reaction GROUP BY
  substance_id,
  local_number,
  report_date,
  reaction,
  duration,
  outcome,
  seriousness_criteria;
DROP TABLE import.substance_reaction;
ALTER TABLE import.substance_reaction_unique RENAME TO substance_reaction;
Remove duplicates from substance_literature
CREATE TABLE import.substance_literature_unique AS
SELECT
  substance_id,
  local_number,
  report_date,
  literature
FROM import.substance_literature GROUP BY
  substance_id,
  local_number,
  report_date,
  literature;
DROP TABLE import.substance_literature;
ALTER TABLE import.substance_literature_unique RENAME TO substance_literature;
Remove duplicates from product
CREATE TABLE import.product_unique AS
SELECT
  product_id,
  local_number,
  report_type,
  report_date,
  qualification,
  country,
  age_group_lower_months,
  age_group_upper_months,
  age_group_reporter,
  is_child_report,
  sex,
  serious
FROM import.product GROUP BY
  product_id,
  local_number,
  report_type,
  report_date,
  qualification,
  country,
  age_group_lower_months,
  age_group_upper_months,
  age_group_reporter,
  is_child_report,
  sex,
  serious;
 DROP TABLE import.product;
 ALTER TABLE import.product_unique RENAME TO product;
Remove duplicates from product_concomitant_drug_list
CREATE TABLE import.product_concomitant_drug_list_unique AS
SELECT
  product_id,
  local_number,
  report_date,
  drugs,
  characteristic,
  indication,
  action,
  duration,
  dose,
  route
FROM import.product_concomitant_drug_list GROUP BY
  product_id,
  local_number,
  report_date,
  drugs,
  characteristic,
  indication,
  action,
  duration,
  dose,
  route;
 DROP TABLE import.product_concomitant_drug_list;
 ALTER TABLE import.product_concomitant_drug_list_unique
   RENAME TO product_concomitant_drug_list;
Remove duplicates from product_subject_drug_list
CREATE TABLE import.product_subject_drug_list_unique AS
select
  product_id,
  local_number,
  report_date,
  drugs,
  characteristic,
  indication,
  action,
  duration,
  dose,
  route
FROM import.product_subject_drug_list GROUP BY
  product_id,
  local_number,
  report_date,
  drugs,
  characteristic,
  indication,
  action,
  duration,
  dose,
  route;
 DROP TABLE import.product_subject_drug_list;
 ALTER TABLE import.product_subject_drug_list_unique
   RENAME TO product_subject_drug_list;
Remove duplicates from product_reaction
CREATE TABLE import.product_reaction_unique AS
SELECT
  product_id,
  local_number,
  report_date,
  reaction,
  duration,
  outcome,
  seriousness_criteria
FROM import.product_reaction GROUP BY
  product_id,
  local_number,
  report_date,
  reaction,
  duration,
  outcome,
  seriousness_criteria;
 DROP TABLE import.product_reaction;
 ALTER TABLE import.product_reaction_unique RENAME TO product_reaction;
Remove duplicates from product_literature
CREATE TABLE import.product_literature_unique AS
SELECT
  product_id,
  local_number,
  report_date,
  literature
FROM import.product_literature GROUP BY
  product_id,
  local_number,
  report_date,
  literature;
DROP TABLE import.product_literature;
ALTER TABLE import.product_literature_unique RENAME TO product_literature;
Content
Running the following script will generate metrics. When you run this script on your database, it should match the metrics from the database dump called ema.dump that should accompany this document.
WITH tbl AS
  (SELECT table_schema,
          TABLE_NAME
   FROM information_schema.tables
   WHERE TABLE_NAME NOT LIKE 'pg_%'
     AND table_schema IN ('public', 'import'))
SELECT table_schema,
       TABLE_NAME,
       (xpath('/row/c/text()', query_to_xml(
           format(
               'SELECT count(*) as c from %I.%I',
               table_schema, TABLE_NAME),
               FALSE, TRUE, ''))
       )[1]::text::int AS rows_n
FROM tbl
ORDER BY rows_n DESC;
Result of running the script to generate metrics:
| table_schema | table_name | rows_n |
|---|---|---|
| import | substance_reaction | 45951332 |
| import | substance_subject_drug_list | 32594176 |
| import | substance_concomitant_drug_list | 21117169 |
| import | substance | 13457327 |
| import | product_reaction | 10881192 |
| import | product_subject_drug_list | 6453406 |
| import | product_concomitant_drug_list | 5932744 |
| import | product | 3369026 |
| import | substance_literature | 1499182 |
| import | product_literature | 109405 |
| public | substance_cases_per_country | 30979 |
| public | product_cases_per_country | 11759 |
| import | substances | 4333 |
| import | products | 1469 |
Now that we have cleaned all duplicates from all tables, we proceed to look into the data to perform analyses.
Analysis
This chapter contains a number of analyses that are given as examples on how to process and access the data. We strongly encourage you to run these examples as they will give insight the integrity of the data you are working with. If your database generates different results or you detect errors, please inform us. When you create and perform your own analyses, please share your code and outcome preferably under the CC-BY-NC-SA license.
Reports
In this chapter we perform some example analyses on reports.
Unique Reports
We want to know about unique reports. The key identifying value of a report is the local number. We asumed these to be unique but reports can be updated or even deleted over time. We noticed that when updates take place, another report with the same local number can appear in the downloads. this can be across multiple line listings so it is a bit hard to detect when using the EMA portal, but we discovered they are present. Besides that, reports are overlapping between substance line listings and product line listings. Our first course of action is to grab all local number's and isolate them in a table. We use a table to increase performance later on when we want to access unique reports again.
Add a table schema
Because we do not want to polute the public and import schema's, we create a new schema to create derived tables.
CREATE SCHEMA analyses;
Number of reports
First, we select all unique reports from the substance table and create a new table with the results.
CREATE TABLE analyses.icsr_temp AS
  SELECT
    local_number,
    max(report_date) AS report_date,
    max(country) AS country
  FROM import.substance
  GROUP BY local_number;
This should render 10187759 results
Then we insert the unique reports from the product table into the table generated in the previous query.
INSERT INTO analyses.icsr_temp
  SELECT
    local_number,
    max(report_date) AS report_date,
    max(country) AS country
  FROM import.product
  GROUP BY local_number;
Which should add another 3106773 into the icsr table.
Then we copy the reports into a table that merges the unique reports from the substance table and the product table so it cannot contain double records.
CREATE TABLE analyses.icsr AS
  SELECT
    local_number,
    max(report_date) AS report_date
  FROM analyses.icsr_temp
  GROUP BY local_number;
This should render 10210452 results.
We can now drop the temporary table.
DROP TABLE analyses.icsr_temp;
Let's see how much unique reports remain.
The final result is that we have 10210452 unique reports in the analyses.icsr table.
EMA reports 25.3 million Case Safety Reports (that represent 15 million cases) in the following document.
21 March 2023, EMA/900566/2022, H-Division, 2022 Annual Report on EudraVigilance for the European Parliament, the Council and the Commission, Reporting period: 1 January to 31 December 2022.
What we found is that the resulting table contains 10210452 rows, approx. 10 million unique reports.
Unique reports per year
We can also count the number of unique reports per year running the following query.
SELECT
  extract(year from date_trunc('year', report_date)) AS "year",
  count(*)
FROM analyses.icsr
GROUP BY date_trunc('year', report_date);
This should render:
| year | count |
|---|---|
| 2002 | 35 |
| 2003 | 11053 |
| 2004 | 19512 |
| 2005 | 77431 |
| 2006 | 124033 |
| 2007 | 157358 |
| 2008 | 465759 |
| 2009 | 331834 |
| 2010 | 244258 |
| 2011 | 289149 |
| 2012 | 415608 |
| 2013 | 479409 |
| 2014 | 485101 |
| 2015 | 479275 |
| 2016 | 452669 |
| 2017 | 592893 |
| 2018 | 732772 |
| 2019 | 761480 |
| 2020 | 675657 |
| 2021 | 1475566 |
| 2022 | 1518932 |
| 2023 | 420668 |
(22 rows)
From this table we can see that the database starts to really receive reports in 2003, reaching a tenfold of reports from 2006, seeing a steep rise in 2008 and eventually reaching 100 times the number of reports from the early 2000's in 2021 declining again in 2022 and given our reports were downloaded in July, our careful estimate is that this decline will probably continue in 2023.
Report versions
With a simple query, it is easy to see that reports when only looking at their local_number have multiple versions. Let's select the top 10 reports with the most versions.
SELECT
  local_number,
  count(*)
FROM import.substance
GROUP BY local_number
ORDER BY count(*) DESC LIMIT 10;
| local_number | count |
|---|---|
| EU-EC-2950025 | 133 |
| EU-EC-10015259316 | 123 |
| EU-EC-10015258987 | 106 |
| EU-EC-12370933 | 100 |
| EU-EC-10014572231 | 99 |
| EU-EC-10010813941 | 98 |
| EU-EC-10015268466 | 94 |
| EU-EC-10015163949 | 94 |
| EU-EC-10015261376 | 94 |
| EU-EC-10014947659 | 93 |
(10 rows)
Can a report span multiple days?
Let's check:
SELECT
  local_number,
  COUNT(DISTINCT report_date)
FROM import.substance
GROUP BY local_number
ORDER BY COUNT(DISTINCT report_date) DESC LIMIT 10;
| local_number | count |
|---|---|
| EU-EC-1000000 | 1 |
| EU-EC-10000000 | 1 |
| EU-EC-10000000011 | 1 |
| EU-EC-10000000016 | 1 |
| EU-EC-10000000019 | 1 |
| EU-EC-10000000021 | 1 |
| EU-EC-10000000022 | 1 |
| EU-EC-10000000024 | 1 |
| EU-EC-10000000025 | 1 |
| EU-EC-10000 | 1 |
(10 rows)
it seems it can't.
So what is causing multiple versions of a report?
We find that the report with local_number "EU-EC-2950025" has 133 versions. We will look at this report in more detail. First of all, we check if our previous conclusion that the date does not change holds.
SELECT
  local_number,
  report_date,
  COUNT(*)
FROM import.substance
WHERE
  local_number = 'EU-EC-2950025'
GROUP BY
  local_number,
  report_date;
| local_number | report_date | count |
|---|---|---|
| EU-EC-2950025 | 2009-07-13 | 133 |
It does, all the versions are from exactly the same date (day). Let's look at the is_child_report boolean to see if at least one of the versions is marked as a parent.
SELECT
  local_number,
  report_date,
  is_child_report,
  COUNT(*)
FROM import.substance
WHERE
  local_number = 'EU-EC-2950025'
GROUP BY
  local_number,
  report_date,
  is_child_report;
It turns out they are all child reports.
| local_number | report_date | is_child_report | count |
|---|---|---|---|
| EU-EC-2950025 | 2009-07-13 | t | 133 |
Could it have something to do with the substance_id?
SELECT
  local_number,
  report_date,
  substance_id,
  COUNt(*)
FROM
  import.substance
WHERE local_number = 'EU-EC-2950025'
GROUP BY
  local_number,
  report_date,
  is_child_report,
  substance_id;
| local_number | report_date | substance_id | count |
|---|---|---|---|
| EU-EC-2950025 | 2009-07-13 | 14621 | 1 |
| EU-EC-2950025 | 2009-07-13 | 14623 | 1 |
| EU-EC-2950025 | 2009-07-13 | 14640 | 1 |
| ..... | ..... | ..... | ...... |
| EU-EC-2950025 | 2009-07-13 | 76884 | 1 |
| EU-EC-2950025 | 2009-07-13 | 201161 | 1 |
| EU-EC-2950025 | 2009-07-13 | 228030 | 1 |
(133 rows) (truncated for readability)
As the table shows: It does. This report spans 133 substances. We can conclude for this particular report that it is a report that is related to multiple substances. Our scripts to get line listings from EMA loops all substance of product identifiers and thus will return a list of reports per substance and product. This means that where the local_number should be the so called primary key across our database, it is impossible to use it that way in the downloading process but the import.product and import.substance tables should have a UNIQUE(substance_id, local_number) combination.
Do we have unique combinations of id and local_number?
Let's see if the combination product_id and local_number is unique:
ALTER TABLE import.product ADD CONSTRAINT
  product_unique_local_number_product_id
UNIQUE (product_id, local_number);
If this is the case, we should not get an error. It is indeed true. The output is
ALTER TABLE
We repeat the process for the substance table
ALTER TABLE import.substance ADD CONSTRAINT
  substance_unique_local_number_substance_id
UNIQUE (substance_id, local_number);
Again, we should not get an error, so the output should be
ALTER TABLE
We can now say that the product and substance tables have the integrity we want, that all the records are unique for the combination between the identifier of the substance(substance_id) or product(product_id) and the report identifier (local_number)
Reports per age group
It will be interesting to see how the age groups correlate. The original line-listings contain several age group definitions that we split up and stored as integers representing the number of months for the lower and upper age group boundaries (when given) because the smallest age group we found is "0 to 2 months" and we wanted to make sure we can detect that age group as well.
So, what age groups do we have and what can we tell about them in relation to reports? Let's take a look at the substance table.
SELECT
  age_group_lower_months/12 age_from,
  age_group_upper_months/12 age_to,
  COUNT(DISTINCT local_number)
FROM import.substance
GROUP BY
  age_group_lower_months,
  age_group_upper_months
ORDER BY COUNT(DISTINCT local_number) DESC;
| age_from | age_to | count |
|---|---|---|
| 18 | 64 | 4769137 |
| 2231876 | ||
| 65 | 85 | 2216231 |
| 85 | 315824 | |
| 0 | 2 | 211532 |
| 3 | 11 | 204186 |
| 12 | 17 | 203213 |
| 0 | 0 | 35760 |
We can see that most reports are for the age group 18 to 64 years, followed by unspecified, followed by 65 to 85 years.
SELECT
  age_group_lower_months/12 age_from,
  age_group_upper_months/12 age_to,
  (age_group_upper_months - age_group_lower_months)/12 AS "range",
  COUNT(DISTINCT local_number)
FROM import.substance
GROUP BY age_group_lower_months, age_group_upper_months
ORDER BY age_group_lower_months DESC;
| age_from | age_to | range | count |
|---|---|---|---|
| 2216231 | |||
| 85 | 315824 | ||
| 65 | 85 | 20 | 2231876 |
| 18 | 64 | 46 | 4769137 |
| 12 | 17 | 5 | 211532 |
| 3 | 11 | 8 | 204186 |
| 0 | 2 | 1 | 203213 |
| 0 | 0 | 0 | 35760 |
Ranges of the age groups are not equal. This makes them incomparable as f.i. the age group 18 to 64 years ranges 46 years while other groups are way smaller.
Reports per country
We decided to investigate, as an example, what the distribution is of the reports per country. For this we used public.substance_cases_per_country and public.product_cases_per_country these tables contain the country, the product/substance code and the number of cases for which it is unclear if these are reports or another undisclosed property either generated, aggregated or summarized from reports or other, undisclosed information. We use a query to summarize content of the tables.
SELECT
  sum(value)
FROM public.substance_cases_per_country;
Result: 6641886 cases.
This is roughly 64% of the unique number of reports we found earlier.
SELECT
  sum(value)
FROM public.product_cases_per_country;
Result: 1351575 cases.
Together these are roughly 8 of the 10 million records that are publically exposed through EMA, and only 8 of the15 million cases as stated in the EMA annual report towards the European commission. These numbers therefor have to be taken with a grain of salt, but we can check if there is a trend in what is publicly available.
get the top 10 countries for substance
SELECT
 country,
 sum(value),
 floor(sum(value)/(
    SELECT
      sum(value)
    FROM public.substance_cases_per_country
  )*100)::numeric::integer AS percentage
FROM public.substance_cases_per_country
GROUP BY country
ORDER BY sum DESC LIMIT 10;
| country | sum | percentage |
|---|---|---|
| France | 1404436 | 21 |
| Germany | 1271894 | 19 |
| Italy | 791529 | 11 |
| United Kingdom | 522275 | 7 |
| Netherlands | 498157 | 7 |
| Spain | 365283 | 5 |
| Sweden | 281317 | 4 |
| Austria | 245752 | 3 |
| Poland | 164281 | 2 |
| Denmark | 132578 | 1 |
For substances, France is contributing ~21% of all cases, Germany ~19%, Italy ~11%, United Kingdom and the Netherlands both ~7%, Spain ~5%, Sweden ~4%, Austria ~3%, Poland ~2%, and the rest of the countries less then 2%. We roughly conclude that five countries contribute ~63% of all cases for substances.
Get the top 10 countries for product
select
  country, sum(value),
  floor(sum(value)/(
    select
      sum(value)
    from public.product_cases_per_country
  )*100)::numeric::integer as percentage
from public.product_cases_per_country
GROUP BY country order by sum desc limit 10;
| country | sum | percentage |
|---|---|---|
| Germany | 276184 | 20 |
| France | 265276 | 19 |
| Italy | 182996 | 13 |
| United Kingdom | 140469 | 10 |
| Netherlands | 75558 | 5 |
| Spain | 74248 | 5 |
| Sweden | 43867 | 3 |
| Belgium | 30437 | 2 |
| Austria | 35716 | 2 |
| Greece | 30392 | 2 |
For products, Germany is contributing ~20% of all cases, France ~19%, Italy ~13%, United Kingdom ~10%, Netherlands and Spain both ~5%, Sweden ~3%, Austria, Greece, Belgium ~2% and the rest of the countries less then 2%. We roughly conclude that four countries contribute ~62% of all cases for products.
It is strange that between product cases and substance cases there are discrepancy in the percentages which slightly alters the sequence of the “leader board”. But roughly most contributions are by France/Germany, Italy, UK/Netherlands, Spain.
So there seem to be four to five countries that produce more then 60% of the total number of cases that are reported out of the total of 27 in the European Economic Area.
We do however want to state that absolute numbers should be related to population numbers as bigger countries can f.i. have more health professionals and more reporting but lower distribution when it comes to the size of the population. in further study these numbers could be correlated with the UN or World Bank population numbers. This however, is outside the scope of this example.
Products
Top 10 products
select
  a.product_id,
  b.name,
  count(distinct a.local_number)
from import.product a
  join import.products b
  on a.product_id = b.product_id
GROUP BY
  a.product_id,
  b.name
order by
  count(distinct a.local_number) desc
limit 10;
| product_id | name | count |
|---|---|---|
| 77936 | REVLIMID | 157288 |
| 45328 | ENBREL | 108091 |
| 58535 | REMICADE | 76957 |
| 58830 | HUMIRA | 73708 |
| 176663 | ELIQUIS | 64894 |
| 86304 | PRADAXA | 51304 |
| 47388 | LYRICA | 49658 |
| 58467 | AVASTIN | 39258 |
| 49090 | PLAVIX | 34943 |
| 12129169 | KEYTRUDA | 34024 |
Product details
The top count substance REVLIMID is a cancer medicine, the second most reported ENBREL is an anti-inflammatory drug. Let's take a look at some of the other products in detail. As an example we will take two products, Keytruda, also a cancer medicine and Inflectra another anti-inflammatory medicine.
Inflectra
Let's look for their product_id's:
SELECT * FROM
  import.products
WHERE
  name ILIKE '%flectra';
This gives us one results
| product_id | name |
|---|---|
| 435328 | INFLECTRA |
We will use the product_id's to dig deeper for information.
Seriousness
SELECT
  product_id,
  seriousness_criteria,
  COUNT(distinct local_number)
FROM import.product_reaction
WHERE product_id = 435328
GROUP BY
  product_id,
  seriousness_criteria
ORDER BY COUNT(distinct local_number )desc limit 10;
| product_id | seriousness_criteria | count |
|---|---|---|
| 435328 | Other Medically Important Condition | 11125 |
| 435328 | 11101 | |
| 435328 | Caused/Prolonged Hospitalisation | 2439 |
| 435328 | Caused/Prolonged Hospitalisation, Other Medically Important Condition | 1833 |
| 435328 | Results in Death | 148 |
| 435328 | Life Threatening | 116 |
| 435328 | Results in Death, Other Medically Important Condition | 102 |
| 435328 | Disabling | 78 |
| 435328 | Life Threatening, Caused/Prolonged Hospitalisation | 54 |
| 435328 | Disabling, Other Medically Important Condition | 44 |
(10 rows)
Reporting range
We want to know when the first and the last reports where issued
SELECT
  product_id,
  min(report_date),
  max(report_date),
  count(distinct local_number)
FROM import.product_reaction
WHERE product_id = 435328
GROUP BY product_id;
| product_id | min | max | count |
|---|---|---|---|
| 435328 | 2014-08-20 | 2023-06-11 | 15106 |
Which shows that the first report on Inflectra was issued in 2014 and the last recently. It also shows that a total of 15106 reports on this product have been filed.
SELECT
  product_id,
  extract(year from date_trunc('year', report_date)) AS "year",
  count(distinct local_number)
FROM import.product_reaction
WHERE product_id = 435328
GROUP BY product_id, date_trunc('year',report_date);
| product_id | year | count |
|---|---|---|
| 435328 | 2014 | 10 |
| 435328 | 2015 | 142 |
| 435328 | 2016 | 383 |
| 435328 | 2017 | 613 |
| 435328 | 2018 | 933 |
| 435328 | 2019 | 1263 |
| 435328 | 2020 | 1650 |
| 435328 | 2021 | 1896 |
| 435328 | 2022 | 2811 |
| 435328 | 2023 | 5405 |
(10 rows)
We see a year over year rise in the number of reports then a rise of reports that almost doubles in 2023 and given the database dates from July 2023, a probably even steeper increase.
Keytruda
Let's look for their product_id's:
SELECT * FROM
 import.products
WHERE
 name ILIKE '%truda';
This gives us one results
| product_id | name |
|---|---|
| 12129169 | KEYTRUDA |
We will use the product_id's to dig deeper for information.
Seriousness
SELECT
  product_id,
  seriousness_criteria,
  COUNT(distinct local_number)
FROM import.product_reaction
WHERE product_id = 12129169
GROUP BY
  product_id,
  seriousness_criteria
ORDER BY COUNT(distinct local_number) desc limit 10;
| product_id | seriousness_criteria | count |
|---|---|---|
| 12129169 | Other Medically Important Condition | 14657 |
| 12129169 | 6453 | |
| 12129169 | Caused/Prolonged Hospitalisation, Other Medically Important Condition | 5917 |
| 12129169 | Caused/Prolonged Hospitalisation | 5462 |
| 12129169 | Results in Death, Other Medically Important Condition | 2725 |
| 12129169 | Results in Death, Caused/Prolonged Hospitalisation, Other Medically Important Condition | 1213 |
| 12129169 | Results in Death | 747 |
| 12129169 | Life Threatening, Caused/Prolonged Hospitalisation, Other Medically Important Condition | 620 |
| 12129169 | Results in Death, Life Threatening, Caused/Prolonged Hospitalisation, Other Medically Important Condition | 314 |
| 12129169 | Caused/Prolonged Hospitalisation, Disabling, Other Medically Important Condition | 255 |
Reporting range
We want to know when the first and the last reports where issued
SELECT
  product_id,
  min(report_date),
  max(report_date),
  count(distinct local_number)
FROM import.product_reaction
WHERE product_id = 12129169
GROUP BY product_id;
| product_id | min | max | count |
|---|---|---|---|
| 12129169 | 2014-10-13 | 2023-06-11 | 34024 |
Which shows that the first report on Keytruda was issued in 2014 and the last recently. It also shows that a total of 34024 reports on this product have been filed.
SELECT
  product_id,
  extract(year from date_trunc('year', report_date)) AS "year",
  count(distinct local_number)
FROM import.product_reaction
WHERE product_id = 12129169
GROUP BY product_id, date_trunc('year',report_date);
| product_id | year | count |
|---|---|---|
| 12129169 | 2014 | 35 |
| 12129169 | 2015 | 317 |
| 12129169 | 2016 | 1101 |
| 12129169 | 2017 | 1896 |
| 12129169 | 2018 | 4066 |
| 12129169 | 2019 | 5167 |
| 12129169 | 2020 | 4055 |
| 12129169 | 2021 | 4843 |
| 12129169 | 2022 | 7054 |
| 12129169 | 2023 | 5490 |
We see a year over year rise in the number of reports with a dip in 2020, then a rise of reports that almost doubles in 2022 and given this database was created in July 2023 a possible rise in 2023 as well.
Product literature
To see if we can get valuable information from the literature, we can use the PostgreSQL text search features functionality.
We can gather statistics about the most used words. We use "english" as the dictionary, this will remove common words like "the", "and", "is" from the results.
SELECT word, ndoc
   FROM ts_stat($$
     SELECT to_tsvector('english', literature)
     FROM import.product_literature AS t
  $$)
  where LENGTH(word) > 4
  order by
    ndoc desc,
    LENGTH(word) desc
  limit 10;
| word | ndoc |
|---|---|
| journal | 28961 |
| patient | 28746 |
| societi | 24586 |
| japanes | 22833 |
| therapi | 18066 |
| treatment | 17515 |
| cancer | 15571 |
| annual | 15029 |
| clinic | 14086 |
| literatur | 12188 |
(10 rows)
We can also search for literature references containing one ore more specific words, f.i. "covid". let's do that and find the 10 most referenced literature with the number of reports referencing them. As we will see, it is hard to detect any pattern, but there are more advanced ways to seek through text in PostgreSQL and we encourage everyone that is seriously interested in literature used in reports to look at the PostgreSQL documentation on text search.
select
  trim(literature),
  COUNT(DISTINCT local_number)
from import.product_literature
where
  to_tsvector('simple', literature) @@ to_tsquery('simple', 'covid')
GROUP BY trim(literature)
order by COUNT(DISTINCT local_number) desc limit 10;
| Literature | count |
|---|---|
| Lopez G, Valero Zanuy M, Barrios I, et.al.. Acute hypertriglyceridemia in patients with covid-19 receiving parenteral nutrition. Nutrients. 2021;13 (7):. | 29 |
| Hoek A S R, Manintveld C O, Betjes G H M, Hellemons E M, Seghers L, Van Kampen A A J, et al.. COVID-19 in solid organ transplant recipients: a single-center experience. Transplant International. 2020;33:1099–1105 | 21 |
| Elikowski W, Fertala N, Zawodna-Marszalek M, Rajewska-Tabor J, Swidurski W, Wajdlich D, Marszalek A, Skrzywanek P, Pyda M, Zytkiewicz M. [Marked self-limiting sinus bradycardia in COVID-19 patients not requiring therapy in the intensive care unit(https://pubmed.ncbi.nlm.nih.gov/34464372/)] | 12 |
| Aouba A, Baldolli A, Geffray L, Verdon R, Bergot E, Martin-Silva N, et al. Targeting the inflammatory cascade with anakinra in moderate to severe COVID-19 pneumonia: case series. Ann Rheum Dis. 2020;1-2. | 9 |
| Beyls C, Martin N, Hermida A, Et.al. Lopinavir-Ritonavir Treatment for COVID-19 Infection in Intensive Care Unit. Circulation: Arrhythmia and Electrophysiology. 2020 AUG;13(E008798):862-865. | 9 |
| Saez-Gimenez B, Berastegui C, Barrecheguren M, Revilla-Lopez E, Los Arcos I, Alonso R, Aguilar M et.al.. COVID-19 in lung transplant recipients: A multicenter study.. Am J Transplant.. 2021;21:1816-24 | 9 |
| Omidi N, Forouzannia SK, Poorhosseini H, Tafti S.H.A, Salehbeigi S, Lotfi-Tokaldany M. Prosthetic heart valves and the COVID-19 pandemic era: What should we be concerned about?. Journal of cardiac surgery. 2020;35(10) 2500-5. doi:10.1111/jocs.14707 | 8 |
| Elec A, Elec F, Oltean M, et. al.. COVID-19 after kidney transplantation: Early outcomes and renal function following antiviral treatment. Int J Infect Dis. 2021;104:426-432. | 8 |
| Giacchetti G.; Salvio G.; Gianfelice C. et al.. Remote management of osteoporosis in the first wave of the COVID-19 pandemic. Archives of Osteoporosis. 2022;17 (37):1-9 | 8 |
| Havlir, D.. 32nd Annual Medical Management of HIV/AIDS and COVID-19. Live Stream Conference. 2020;unk:unk | 7 |
Substances
Top 10 substances
select
  a.substance_id,
  b.name,
  count(distinct a.local_number)
from import.substance a
  join import.substances b
  on a.substance_id = b.substance_id
GROUP BY
  a.substance_id,
  b.name
order by
  count(distinct a.local_number) desc
limit 10;
| substance_id | name | count |
|---|---|---|
| 42325700 | COVID-19 MRNA VACCINE PFIZER-BIONTECH (TOZINAMERAN) | 1034456 |
| 40995439 | COVID-19 VACCINE ASTRAZENECA (CHADOX1 NCOV-19) | 445801 |
| 40983312 | COVID-19 MRNA VACCINE MODERNA (ELASOMERAN) | 375783 |
| 50950 | LENALIDOMIDE | 165351 |
| 15756 | INFLIXIMAB | 124291 |
| 15535 | ETANERCEPT | 121607 |
| 20353 | METHOTREXATE | 110786 |
| 23893 | ACETYLSALICYLIC ACID | 108986 |
| 128670 | CALCIUM CHLORIDE, SODIUM CHLORIDE, GLUCOSE, SODIUM LACTATE, MAGNESIUM CHLORIDE | 106046 |
| 19980 | LEVONORGESTREL | 102116 |
(10 rows)
Segregate by substance and region
For this example, we want to check metrics of the number of reports per region and differentiate between COVID-19 vaccination substances and other substances.
We need to answer a couple of questions to proceed: Can we filter Economic Area and others? For this we use the country column and group and count all the substance and product table entries.
Checking the country
SELECT
  country,
  COUNT(DISTINCT local_number)
from import.substance GROUP BY country;
| country | count |
|---|---|
| European Economic Area | 5107493 |
| Non European Economic Area | 5078995 |
| Not Specified | 1271 |
SELECT
  country,
  COUNT(DISTINCT local_number)
from import.product GROUP BY country;
| country | count |
|---|---|
| European Economic Area | 1240840 |
| Non European Economic Area | 1865899 |
| Not Specified | 34 |
We see that most reports are received from Non European Economic Area for both substances and products. Given that the EMA is a European database, this is remarkable.
Checking for substances with covid in the name
Now, can we differentiate records that are reported for a substance that has covid in it's name?
The query
SELECT
  COUNT(DISTINCT local_number)
FROM import.substance
WHERE
  substance_id = ANY(ARRAY(
    SELECT substance_id FROM import.substances
    WHERE name ILIKE '%covid%'
  ));
produces 1862731
and
SELECT
  COUNT(DISTINCT local_number)
FROM import.substance
WHERE
  substance_id NOT IN (
    SELECT substance_id FROM import.substances
    WHERE name ILIKE '%covid%'
  );
produces 8338644
When we add these two results together, we get 10201375, but we need to keep in mind that reports can have multiple versions in the database: there are duplicates in the column for local_number as reports can have various versions. This needs to be taken into account. So will our sum equal the total of all unique reports in the table?
SELECT
  COUNT(DISTINCT local_number)
from import.substance;
This query produces 10187759 records. There are multiple substance_id's for a report and reports can end up in the results for having a substance with covid in the name involved combined with other substances. Differentiation between substances with covid in the name and others is possible although the results overlap given that the substance_id can fall in both of the categories we are investigating. Remember, they are examples and results should be used carefully before drawing conclusions. These queries require further investigation.
Creating the required subsets
First, we create a table that groups by the local_number, representing the unique ICSR and stack all values for substance_id, report_date and country for later use.
CREATE TABLE
 analyses.unique_substance_icsr as
  select
   local_number,
   array_agg(distinct substance_id) substance_ids,
   array_agg(distinct report_date) as report_dates,
   array_agg(distinct country) as regions
from import.substance GROUP BY local_number;
produces 10187759 results.
from this table, we then create a new table containing all reports that are related to a substance with covid in the name:
CREATE TABLE analyses.covid_icsr as
  select
    local_number,
    report_dates[1],
    regions[1],
    array_length(substance_ids,1) as substance_count
  from analyses.unique_substance_icsr
  WHERE
    substance_ids && ARRAY(
      SELECT substance_id::numeric::integer FROM import.substances
      WHERE name ILIKE '%covid%'
    )
  order by array_length(substance_ids, 1);
produces 1862731results
A similar query can be used to invert the selection by selecting all substance_id's where the substance_id does not contain the term covid. This way, we get the results we define as others:
CREATE TABLE analyses.non_covid_icsr as
  select
    local_number,
    report_dates[1],
    regions[1],
    array_length(substance_ids,1) as substance_count
  from analyses.unique_substance_icsr
  WHERE NOT substance_ids && ARRAY(
    SELECT substance_id::numeric::integer FROM import.substances
    WHERE name ILIKE '%covid%'
  )
  order by array_length(substance_ids, 1);
produces 8325028 results
This gives us the base for determining the positions numbered 1 to 4 in the matrix:
| COVID-19 | Other | |
|---|---|---|
| European Economic Area | 1 | 2 |
| Other | 3 | 4 |
Segment 1
European Economic Area, substances with covid in the name
CREATE TABLE
  analyses.eea_covid as
    select
      report_dates,
      count(*)
    from
      analyses.covid_icsr
    where regions = 'European Economic Area'
    GROUP BY report_dates order by report_dates;
produces 911 (days on which reports are filed or altered)
Segment 2
European Economic Area, other substances
CREATE TABLE
  analyses.eea_other as
    select
      report_dates,
      count(*)
    from analyses.non_covid_icsr
    where regions = 'European Economic Area'
    GROUP BY report_dates order by report_dates;
produces 6918 (days on which reports are filed or altered)
Segment 3
Other Area, substances with covid in the name
CREATE TABLE
  analyses.non_eea_covid as
    select
      report_dates,
      count(*)
    from analyses.covid_icsr
    where regions != 'European Economic Area'
    GROUP BY report_dates order by report_dates;
produces 865 (days on which reports are filed or altered)
Segment 4
Other Area, other substances
CREATE TABLE
  analyses.non_eea_other as
    select
      report_dates,
      count(*)
    from analyses.non_covid_icsr
    where regions != 'European Economic Area'
    GROUP BY report_dates order by report_dates;
produces 7029 (days on which reports are filed or altered)
Now we can perform a query to ask the database; on what date were most reports recieved on substances with covid in their name?
SELECT * from analyses.eea_covid order by count desc limit 1;
Which results in:
| report_dates | count |
|---|---|
| 2022-06-16 | 15608 |
Showing that most reports on substances with covid in their name where received on the 16th of July in 2022.
Can you think of some more queries?
Top 10 reactions
Reactions
Let's look at the reaction that are present to find the reactions with most reports.
select
  reaction,
  count(*)
from
  import.substance_reaction
GROUP BY reaction
order by count(*) desc limit 10;
| reaction | count |
|---|---|
| Pyrexia | 840351 |
| Headache | 831209 |
| Fatigue | 752054 |
| Nausea | 656244 |
| Drug ineffective | 564964 |
| Dyspnoea | 481568 |
| Diarrhoea | 433502 |
| Arthralgia | 430680 |
| Rash | 429196 |
| Dizziness | 427772 |
Let's do another check and find the reactions with most reports and segregate by outcome
select
  reaction,
  outcome,
  count(*)
from
  import.substance_reaction
GROUP BY reaction, outcome
order by count(*) desc limit 10;
| reaction | outcome | count |
|---|---|---|
| Pyrexia | Recovered/Resolved | 418006 |
| Drug ineffective | 402969 | |
| Off label use | 302933 | |
| Headache | Recovered/Resolved | 300059 |
| Death | Fatal | 292108 |
| Fatigue | Not Recovered/Not Resolved | 248051 |
| Nausea | Recovered/Resolved | 241111 |
| Fatigue | 208296 | |
| Headache | Not Recovered/Not Resolved | 201347 |
| Nausea | 191709 |
It is interesting to see that Death which has the outcome Fatal enters the top 10.
Fatal outcome
Let's find a top 10 with Fatal outcome.
select
 reaction,
 outcome,
 count(*)
from
 import.substance_reaction
where
 outcome ilike '%fatal%'
GROUP BY reaction, outcome
order by count(*) desc limit 10;
| reaction | outcome | count |
|---|---|---|
| Death | Fatal | 292108 |
| Completed suicide | Fatal | 81474 |
| Toxicity to various agents | Fatal | 67831 |
| Cardiac arrest | Fatal | 34689 |
| Pneumonia | Fatal | 27633 |
| Sepsis | Fatal | 27031 |
| Drug abuse | Fatal | 26598 |
| Malignant neoplasm progression | Fatal | 23101 |
| Multiple organ dysfunction syndrome | Fatal | 22958 |
| Respiratory failure | Fatal | 21990 |
Death is not always fatal
As extra analyses, we group the reports where the reaction contains the word death we assume not all reporting has been entered correct as it seems possible to have death as a reaction where the outcome is not equal to "Fatal". An interesting combination of reaction and outcome is "Recovered/Resolved" from "Foetal death". Foetal death is a synonym for "still birth", the death of a foetus needs not be fatal for the mother, whilst it is for the unborn child.
select
  reaction,
  outcome,
  count(*)
from
  import.substance_reaction
where
  reaction ilike '%death%'
GROUP BY reaction, outcome
order by count(*) desc limit 25;
| reaction | outcome | count |
|---|---|---|
| Death | Fatal | 292108 |
| Sudden death | Fatal | 9284 |
| Near death experience | 2844 | |
| Death | Not Specified | 2456 |
| Foetal death | 2341 | |
| Sudden cardiac death | Fatal | 2090 |
| Sudden infant death syndrome | Fatal | 1850 |
| Foetal death | Fatal | 1824 |
| Death | 1786 | |
| Death neonatal | Fatal | 1652 |
| Brain death | Fatal | 1428 |
| Fear of death | 1198 | |
| Death | Not Recovered/Not Resolved | 1171 |
| Accidental death | Fatal | 917 |
| Cardiac death | Fatal | 809 |
| Foetal death | Recovered/Resolved | 754 |
| Apparent death | Recovered/Resolved | 681 |
| Sudden cardiac death | 641 | |
| Cell death | 562 | |
| Near death experience | Recovered/Resolved | 560 |
| Cell death | Recovered/Resolved | 544 |
| Sudden death | 497 | |
| Fear of death | Recovered/Resolved | 464 |
| Sudden unexplained death in epilepsy | Fatal | 461 |
| Foetal death | Not Recovered/Not Resolved | 446 |
(25 rows)
Top 10 reactions for Tozinameran
The number one substance we found earlier was Tozinameran. To find the top 10 reactions with their outcome for the Tozinameran substance, we first lookup the substance_id:
SELECT
  *
from import.substances
where name ilike '%TOZINAMERAN%';
| substance_id | name |
|---|---|
| 42325700 | COVID-19 MRNA VACCINE PFIZER-BIONTECH (TOZINAMERAN) |
| 60123556 | COVID-19 MRNA VACCINE PFIZER-BIONTECH ORIGINAL/OMICRON BA.1 (TOZINAMERAN, RILTOZINAMERAN) |
| 60141237 | COVID-19 MRNA VACCINE PFIZER-BIONTECH ORIGINAL/OMICRON BA.4-5 (TOZINAMERAN, FAMTOZINAMERAN) |
Let's select substance_id 42325700 and see in the reaction table for substances which reactions are related to this substance_id, we will group them by reaction and outcome to get an general idea and limit the result to 10.
select
  reaction,
  outcome,
  count(*)
from
  import.substance_reaction
where substance_id = 42325700
GROUP BY substance_id, reaction, outcome
order by count(*) desc limit 10;
| reaction | outcome | count |
|---|---|---|
| COVID-19 | 98917 | |
| Vaccination failure | 88821 | |
| Headache | Recovered/Resolved | 71871 |
| Pyrexia | Recovered/Resolved | 69366 |
| Fatigue | Not Recovered/Not Resolved | 49876 |
| Headache | Not Recovered/Not Resolved | 49474 |
| Fatigue | Recovered/Resolved | 47029 |
| Myalgia | Recovered/Resolved | 43603 |
| Chills | Recovered/Resolved | 40605 |
| Headache | Recovering/Resolving | 34880 |
In 98917 reports, the reaction was COVID-19. In 88821cases the vaccination failed.
Substance suspect drug list
Select the top 10 of drugs reported on for substances for the suspect drug list table. This table is accidentally named subject instead of suspect.
select
  drugs,
  COUNT(DISTINCT local_number)
from import.substance_subject_drug_list
GROUP BY drugs
order by COUNT(DISTINCT local_number) desc
limit 10;
| drugs | count |
|---|---|
| COMIRNATY [TOZINAMERAN] | 904812 |
| COVID-19 VACCINE ASTRAZENECA | 337828 |
| SPIKEVAX [COVID-19 MRNA VACCINE MODERNA | 316281 |
| VAXZEVRIA [COVID-19 VACCINE ASTRAZENECA | 204072 |
| REVLIMID [LENALIDOMIDE] | 155625 |
| TOZINAMERAN [TOZINAMERAN] | 117032 |
| ENBREL [ETANERCEPT] | 101998 |
| [CLOZAPINE] | 88094 |
| [LEVONORGESTREL] | 82590 |
| REMICADE [INFLIXIMAB] | 73876 |
(10 rows)
Links have been added to the entries in the EPAR information from the EMA website.
"COMIRNATY contains tozinameran, a messenger RNA" as stated here and we find TOZINAMERAN as a substance in the substances list too.
It is interesting to see that most reports are related to a COVID-19 drug, namely the first four entries plus the sixth. From the top-10, the sum of all reports related a COVID-19 drug totals 1880025 if we relate this to the total number of unique reports: 10210452, about 20% of all reports are COVID-19 medicine related.
Another interesting medicine in the top ten list of most reported drugs, is REVLIMID which is a medicine used for the treatment of certain cancers and serious conditions affecting blood cells and bone marrow, namely multiple myeloma, myelodysplastic syndromes and mantle cell and follicular lymphoma.
Substance concomitant drug list
Select the top 10 of drugs reported on for substances for the concomitant drug list table.
select
  drugs,
  COUNT(DISTINCT local_number)
from import.substance_concomitant_drug_list
GROUP BY drugs
order by COUNT(DISTINCT local_number) desc
limit 10;
| drugs | count |
|---|---|
| [PARACETAMOL] | 213671 |
| [ACETYLSALICYLIC ACID] | 205282 |
| [OMEPRAZOLE] | 132309 |
| [PREDNISONE] | 129979 |
| [LEVOTHYROXINE SODIUM] | 127684 |
| [FUROSEMIDE] | 126576 |
| [SIMVASTATIN] | 118803 |
| [METFORMIN, METFORMIN HYDROCHLORIDE, METFORMIN HYDROCHLORIDE BP] | 106566 |
| [ATORVASTATIN] | 101405 |
| [FOLIC ACID] | 101267 |
| (10 rows) |
(10 rows)
It seems from the suspect drug list that medicine names have no square brackets in their name and that the content between square brackets is a substance. Paracetamol comes from a lot of different brands and maybe the EMA decided to group them and omit the name. This can however not be concluded from the data.
Advanced
Menstrual issues
A recent strong increase in heavy menstrual bleeding, was mentioned in the British Medical Journal (BMJ). It is unclear if EMA has looked into this based on their data, what happens when we do it?
select
  reaction,
  count(distinct local_number)
from import.product_reaction
where reaction ilike '%menstru%'
group by reaction
order by count(distinct local_number) desc limit 10;
We can see that related to products, there are 1920 reports mentioning Heavy menstrual bleeding as (one of the) reaction(s).
| reaction | count |
|---|---|
| Heavy menstrual bleeding | 1920 |
| Intermenstrual bleeding | 1100 |
| Menstrual disorder | 1043 |
| Menstruation irregular | 957 |
| Menstruation delayed | 819 |
| Premenstrual syndrome | 91 |
| Premenstrual pain | 18 |
| Menstrual discomfort | 17 |
| Menstruation normal | 10 |
| Menstrual cycle management | 6 |
select
 reaction,
 count(distinct local_number)
from import.substance_reaction
where reaction ilike '%menstru%'
group by reaction
order by count(distinct local_number) desc limit 10;
| reaction | count |
|---|---|
| Heavy menstrual bleeding | 48794 |
| Menstrual disorder | 30349 |
| Intermenstrual bleeding | 26426 |
| Menstruation irregular | 25405 |
| Menstruation delayed | 18877 |
| Premenstrual syndrome | 2325 |
| Menstrual discomfort | 1336 |
| Premenstrual pain | 921 |
| Menstrual cycle management | 300 |
| Menstruation normal | 294 |
For substances it is 48794reports.
We want to see if any substances stick out.
select a.name, b.* from
(select
   --reaction,
   substance_id,
   count(distinct local_number) count
 from import.substance_reaction
 where reaction = 'Heavy menstrual bleeding'
 group by substance_id, reaction) b
 JOIN import.substances a on a.substance_id = b.substance_id
 order by b.count desc limit 10;
| name | substance_id | count |
|---|---|---|
| COVID-19 MRNA VACCINE PFIZER-BIONTECH (TOZINAMERAN) | 42325700 | 25570 |
| COVID-19 MRNA VACCINE MODERNA (ELASOMERAN) | 40983312 | 7791 |
| COVID-19 VACCINE ASTRAZENECA (CHADOX1 NCOV-19) | 40995439 | 5062 |
| LEVONORGESTREL | 19980 | 3405 |
| ETONOGESTREL | 18832 | 1634 |
| DESOGESTREL | 18500 | 383 |
| ETHINYLESTRADIOL, ETONOGESTREL | 39209 | 347 |
| LACTOSE | 25479 | 288 |
| DROSPIRENONE, ETHINYLESTRADIOL | 59494 | 242 |
| COVID-19 MRNA VACCINE PFIZER-BIONTECH ORIGINAL/OMICRON BA.1 (TOZINAMERAN, RILTOZINAMERAN) | 60123556 | 212 |
It seems that, given that "Heavy menstrual bleeding" totals 48794 reports for the substance table and 38423 reports from that same table are related to COVID-19 vaccines, we feel that this should be something of concern. This appears to be something that justifies further research, also by EMA.
Product, Substance, Drug
Throughout the database, we find products and substances but drugs are also mentioned. We are curious about the overlap and the differences and would like to see if we can make head or tails from the different types.
We have tables for products and substances. Is it possible to make a table that contains both and add all entries found for drugs as well? Let's first look at the unique entries in the drug list tables.
SELECT
  'product_suspect_drug_list' as source,
  count(distinct drugs)
FROM
  import.product_subject_drug_list
UNION
SELECT
  'product_concomitant_drug_list' as source,
  count(distinct drugs)
FROM
  import.product_concomitant_drug_list
UNION
SELECT
  'substance_suspect_drug_list' as source,
  count(distinct drugs)
FROM
  import.substance_subject_drug_list
UNION
SELECT
  'substance_concomitant_drug_list' as source,
  count(distinct drugs)
FROM
  import.substance_concomitant_drug_list
UNION
SELECT
  'products' as source,
  count(*)
FROM
  import.products
UNION
SELECT
  'substances' as source,
  count(*)
FROM
  import.substances;
| source | count |
|---|---|
| substances | 4333 |
| substance_suspect_drug_list | 39350 |
| product_suspect_drug_list | 18960 |
| product_concomitant_drug_list | 34939 |
| substance_concomitant_drug_list | 65836 |
| products | 1469 |
As we can see there is a big difference between the amount of products, substances and drugs.
The drug lists contains textual information which seems to be a combination of medicine (not always present as product and sometimes omitted) and substances between square brackets.
We are going to try to get everything into a new table to see if we can find any relations.
CREATE TABLE analyses.temp_names as
  SELECT distinct drugs as "words" from import.product_subject_drug_list;
insert into analyses.temp_names
  SELECT distinct drugs from import.substance_subject_drug_list;
insert into analyses.temp_names
  SELECT distinct drugs from import.product_concomitant_drug_list;
insert into analyses.temp_names
  SELECT distinct drugs from import.substance_concomitant_drug_list;
insert into analyses.temp_names
  SELECT distinct name from import.products;
insert into analyses.temp_names
  SELECT distinct name from import.substances;
create table analyses.name as select distinct words from analyses.temp_names;
drop table analyses.temp_names;
SELECT count(*) from analyses.name;
| count |
|---|
| 84990 |
We find that the result of getting the distinct set of names, words or whatever we should call this is less then the sum of all found words from all tables that contain names or descriptions for substance, product or drug. Can we find intersections and relations?
At least we now have one long list to search through. Let's do a little experiment.
Mentions of a product
select * from analyses.name where words ilike '%comirnaty%';
| words |
|---|
| COMIRNATY 10 MICROGRAMS/DOSE CONCENTRATE FOR DISPERSION FOR INJECTION COVID-19 MRNA VACCINE |
| COMIRNATY 10 MICROGRAMS/DOSE CONCENTRATE FOR DISPERSION FOR INJECTION [TOZINAMERAN] |
| COMIRNATY 10 MICROGRAMS/DOSE [TOZINAMERAN] |
| COMIRNATY 30 MICROGRAMS/DOSE CONCENTRATE FOR DISPERSION FOR INJECTION COVID-19 MRNA VACCINE |
| COMIRNATY 30 MICROGRAMS/DOSE CONCENTRATE FOR DISPERSION FOR INJECTION [TOZINAMERAN] |
| COMIRNATY 30 MICROGRAMS/DOSE DISPERSION FOR INJECTION COVID-19 MRNA VACCINE |
| COMIRNATY 30 MICROGRAMS/DOSE DISPERSION FOR INJECTION [TOZINAMERAN] |
| COMIRNATY 30 MICROGRAMS/DOSE [TOZINAMERAN] |
| COMIRNATY 3 MICROGRAMS/DOSE CONCENTRATE FOR DISPERSION FOR INJECTION COVID-19 MRNA VACCINE |
| COMIRNATY CONCENTRATE FOR DISPERSION FOR INJECTION 10 MICROGRAMS/DOSE [TOZINAMERAN] |
| COMIRNATY CONCENTRATE FOR DISPERSION FOR INJECTION 30 MICROGRAMS/DOSE [TOZINAMERAN] |
| COMIRNATY CONCENTRATE FOR DISPERSION FOR INJECTION COVID-19 MRNA VACCINE |
| COMIRNATY CONCENTRATE FOR DISPERSION FOR INJECTION [TOZINAMERAN] |
| COMIRNATY COVID-19 MRNA VACCINE |
| COMIRNATY DISPERSION FOR INJECTION [TOZINAMERAN] |
| COMIRNATY ORIGINAL/OMICRON BA.1 |
| COMIRNATY ORIGINAL/OMICRON BA.1 DISPERSION FOR INJECTION |
| COMIRNATY ORIGINAL/OMICRON BA.1 [TOZINAMERAN, RILTOZINAMERAN] |
| COMIRNATY ORIGINAL/OMICRON BA.4-5 |
| COMIRNATY ORIGINAL/OMICRON BA.4-5 COVID-19 MRNA VACCINE |
| COMIRNATY ORIGINAL/OMICRON BA.4-5 [TOZINAMERAN, 5'-CAPPED MRNA ENCODING SARS-COV-2, OMICRON VARIANTS BA.4 AND BA.5, SPIKE PROTEIN, PRE-FUSION STABILISED |
| COMIRNATY ORIGINAL/OMICRON BA.4-5 [TOZINAMERAN, FAMTOZINAMERAN] |
| COMIRNATY [TOZINAMERAN] |
As seen, there are products and substances mentioned in the drug lists, but also information about the dose and sometimes even unrelated terms.
Language specific information
One of the things we do not seem to be able to extract from the EMA database is the country a report originates from. But looking at the created analyses.name table shows something interesting. There is information in the words that are language specific. If we look for instance for the text per dag which is Dutch for per day, we find 3 rows.
select * from analyses.name where words ilike '%per dag%';
| words |
|---|
| 1000MG 3X PER DAG [NOT AVAILABLE] |
| DE PIL 30 MG PER DAG [NOT AVAILABLE] |
| KOELZALF 3X PER DAG OP DE HUID AANBRENGEN; [NOT AVAILABLE] |
Another particular Dutch word is prik let's see if we can find that too:
select * from analyses.name where words ilike '%prik%';
| words |
|---|
| 6DE PRIK DT [NOT AVAILABLE] |
| BOOSTRIX POLIO INJSUSP WWSP 0,5ML / 4DE PRIK DKTP/HIB/HEPATITIS B [NOT AVAILABLE] |
| EEN PRIK IN MIJN SCHOUDER TEGEN DE SLIJMBEURSONTSTEKING [NOT AVAILABLE] |
| RUGGENPRIK [NOT AVAILABLE] |
| RUGGEPRIK [NOT AVAILABLE] |
| TETANUS PRIK [NOT AVAILABLE] |
Here we also discover the Dutch word tegen meaning against. Let's look for that too.
select * from analyses.name where words ilike '%tegen%';
| words |
|---|
| 2 GANGBARE MEDICIJNEN TEGEN HOGE BLOEDDRUK. [NOT AVAILABLE] |
| AANSTIPMIDDEL TEGEN ACNE [NOT AVAILABLE] |
| DIVERSE PUFJES TEGEN MIJN COPD [NOT AVAILABLE] |
| EEN PRIK IN MIJN SCHOUDER TEGEN DE SLIJMBEURSONTSTEKING [NOT AVAILABLE] |
| GENEESMIDDEL TEGEN HOOIKOORTS EN ANDERE ALLERGIEKLACHTEN [NOT AVAILABLE] |
| IETS TEGEN MISSELIJKHEID [NOT AVAILABLE] |
| MIDDEL TEGEN BOEZEM FIBRILEREN [NOT AVAILABLE] |
| MIDDEL TEGEN TRAGE SCHILDKLIER [NOT AVAILABLE] |
| ONTSTEKINGSREMMER TEGEN ARTRITIS PSORIATICA [NOT AVAILABLE] |
| PUFJE TEGEN ASTMA [NOT AVAILABLE] |
| TEGEN DE MISSELIJKHEID EN TEGEN EEN ALLERGISCHE REACTIE [NOT AVAILABLE] |
| ZALFJES TEGEN PSORIASIS [NOT AVAILABLE] |
Although we cannot discover in detail from which country a report originates, we can determine that the Dutch language is used in specific reports. Maybe this method can also be used to investigate other languages?
Word cloud
To get insight in the most used words, we generate a table that can be used to create a word cloud.
WITH words AS (
    SELECT unnest(string_to_array(lower(words), ' ')) AS word
    FROM analyses.name
)
SELECT word, count(*) as frequency  FROM words
GROUP BY word order by count(*) desc limit 25;
| word | frequency |
|---|---|
| [not | 16887 |
| available] | 16871 |
| acid, | 5725 |
| sodium | 5111 |
| not | 4488 |
| hydrochloride, | 4425 |
| available | 4292 |
| for | 3875 |
| mg | 3647 |
| chloride, | 3021 |
| calcium | 2874 |
| hydrochloride] | 2603 |
| 2424 | |
| magnesium | 2259 |
| nos] | 1974 |
| solution | 1913 |
| potassium | 1850 |
| unspecified | 1850 |
| chloride | 1742 |
| medication | 1633 |
| nos, | 1558 |
Maybe we should clean up special characters like ] and , but for now this will give us an idea.
We generate a file containing all words from the previous query.
COPY (SELECT unnest(string_to_array(lower(words), ' ')) AS word
    FROM analyses.name) TO '/var/lib/postgres/wordcloud.csv' (format CSV);
Uploading this file to Free World Cloud Generator renders a nice word cloud.
If we ignore the word "available" for now, it is interesting to see words like (hydro)chloride, aluminium and acid and another Dutch word: "pollen".
Can you detect the most used medicine in the word cloud?
You now should have a general idea about what is available by gathering textual information and stitching it together. Can you think of more advanced uses?
Ivermectine
EMA advises against the use of Ivermectine for COVID-19 prevention treatment.
"Although ivermectin is generally well tolerated at doses authorised for other indications, side effects could increase with the much higher doses that would be needed to obtain concentrations of ivermectin in the lungs that are effective against the virus. Toxicity when ivermectin is used at higher than approved doses therefore cannot be excluded."
Wouldn't it be good to investigate what side effects (reactions) have been reported in EudraVigilance for Ivermectine? This chapter gives some examples of what questions could be asked to the database. Can you come up with more questions? Is Ivermectine, a product or a substance? Is it in any of the drug lists?
Is it a product?
select * from import.products where name ilike '%iverm%';
| product_id | name |
|---|
(0 rows)
Ivermectine is not found.
Is it a substance?
select * from import.substances where name ilike '%iverm%';
| substance_id | name |
|---|---|
| 23261 | IVERMECTIN |
(1 row)
Results in one row and a substance_id. When we check the substance table, we find 3015 unique reports for this substance.
select
  'substance reports' as reported_on,
  count(distinct local_number)
from import.substance where substance_id = 23261;
| reported_on | count |
|---|---|
| substance reports | 3015 |
(1 row)
Comparing outcome
What outcomes do the reports on the Ivermectine substance have?
select
  outcome,
  count(distinct local_number)
from
  import.substance_reaction
where substance_id = 23261 group by outcome;
| outcome | count |
|---|---|
| Fatal | 282 |
| Not Recovered/Not Resolved | 461 |
| Not Specified | 4 |
| Recovered/Resolved | 1661 |
| Recovered/Resolved With Sequelae | 24 |
| Recovering/Resolving | 350 |
| 931 |
How does this compare to f.i. the outcomes for the "COVID-19 MRNA VACCINE PFIZER-BIONTECH (TOZINAMERAN)"" substance?
select
  outcome,
  count(distinct local_number)
from
  import.substance_reaction
where substance_id = 42325700 group by outcome;
| outcome | count |
|---|---|
| Fatal | 13723 |
| Not Recovered/Not Resolved | 354461 |
| Recovered/Resolved | 357564 |
| Recovered/Resolved With Sequelae | 27910 |
| Recovering/Resolving | 214203 |
| 351899 |
We know that there are 3015 reports on the Ivermectine substance. We know there are 1034542 reports on the Tozinameran substance with the substance_id 42325700.
What is the percentage of "Fatal" outcomes for each of these substances?
- Ivermectine:
282 / 3015 = 0.0935.. ~ 9% - Tozinameran:
13723 / 1034542 = 1.3264.. ~ 1%
And for "Recovered/Resolved"?
- Ivermectine:
1661 / 3015 = 0.5509.. ~ 55% - Tozinameran:
357564 / 1034542 = 1.3264.. ~ 34%
We have not looked at the dates of the reports and maybe we are over generalizing. But it is interesting to break this research down further. Can you think of more advanced questions you want answered in comparing substances?
Can we find Ivermectine in the drug lists?
Is Ivermectine mentioned in any of the drug lists? Let's find out and by joining all drug_list counts for the unique number of reports.
select
  'product'as class,
  'suspect' as list_type,
  count(distinct local_number) as count
from import.product_subject_drug_list
where drugs ilike '%iverm%'
UNION
select
  'product'as class,
  'concomitant' as list_type,
  count(distinct local_number) as count
from import.product_concomitant_drug_list
where drugs ilike '%iverm%'
UNION
select
  'substance'as class,
  'suspect' as list_type,
  count(distinct local_number) as count
from import.substance_subject_drug_list
where drugs ilike '%iverm%'
UNION
select
  'substance'as class,
  'concomitant' as list_type,
  count(distinct local_number) as count
from import.substance_concomitant_drug_list
where drugs ilike '%iverm%';
| class | list_type | count |
|---|---|---|
| substance | suspect | 2993 |
| substance | concomitant | 695 |
| product | suspect | 51 |
| product | concomitant | 136 |
There are mentions in the drug lists. It would be good to relate them back to substances and products.
Visualisation
Showing query results as tables in a document only works up to a certain extent. When you want to display large datasets or data evolving over time, a chart or graph may offer better insight.
So we searched the internet to find the right tool that would quickly offer us the ability to create visual enhanced insight. A lot of tooling is available, but few of them are open source, which is one of the requirements we had. We also wanted to be as "cross-platform" as possible, a tool that can run in a browser would be great.
We settled with Metabase, the software version used in this document is Metabase v0.46.5, built on 2023-06-14.
Docker
The only requirement for Metabase is Docker which is available for Windows, Linux and Mac. You can follow the download and install instructions from the website.
Run Metabase
Once Docker is installed, Metabase can be started by running:
docker run -d -p 3000:3000 --name metabase metabase/metabase
This is the default way of installing the open source edition as described on the Metabase website (https://www.metabase.com/start/oss). After running the previous command, point the browser to http://localhost:3000, set up a username and password and connect to the postgresql database directly.
When you open the webpage, you will be greeted by a welcome screen. This screen will show a Let's get started button at first use.
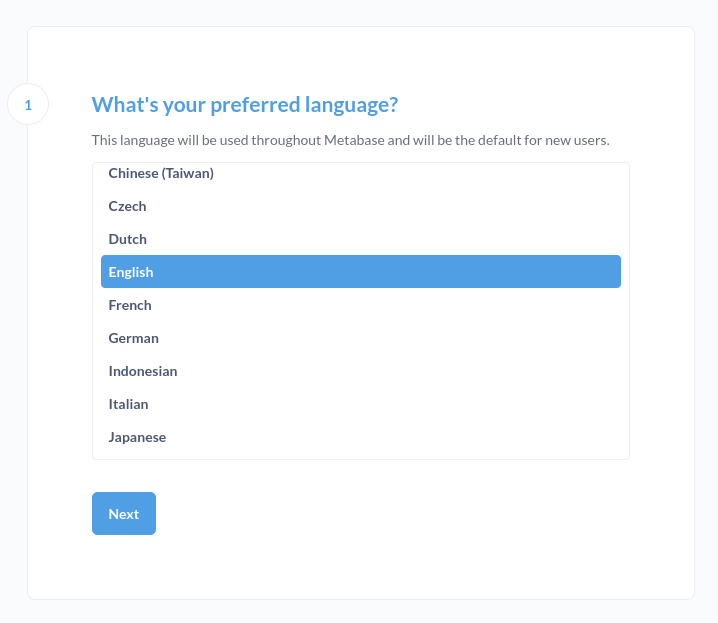
After pressing the button, you will be prompted to select your language. We select English.
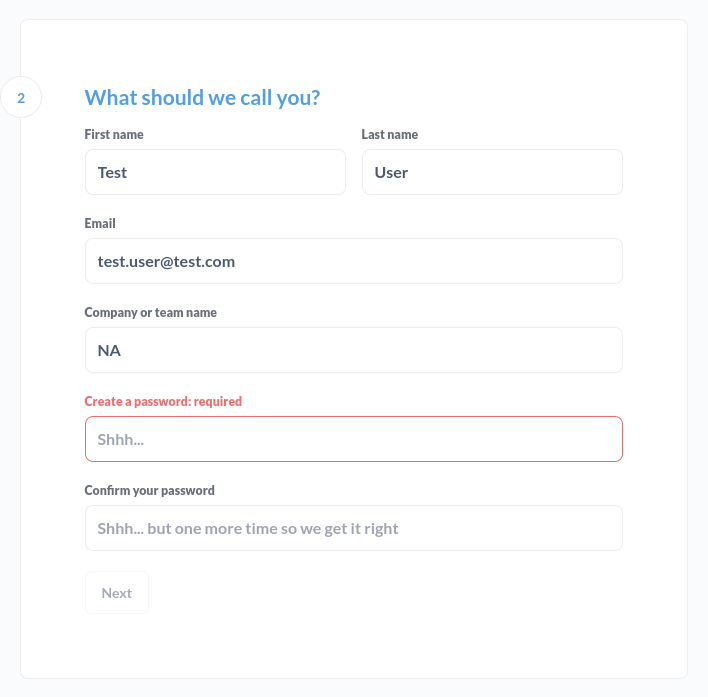
Next, you need to set up a user account. This account will be local to your installation, so don't worry about what you enter here, as long as you remember the email address you use and the password.
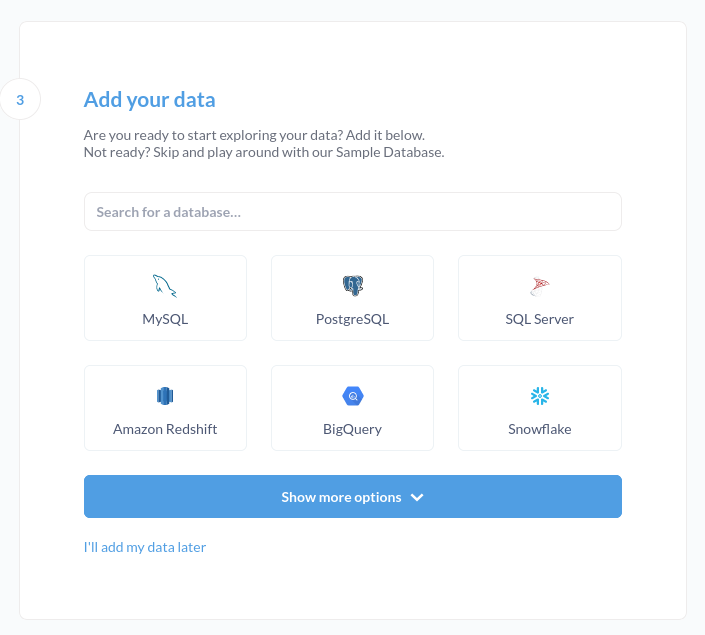
Then you need the to select a Database type, in our case this will be PostgreSQL, the option with the blue elephant.
Because Metabase runs isolated, you cannot use localhost as a host. Make sure you enter the right credentials and select the ip-address to your computer.
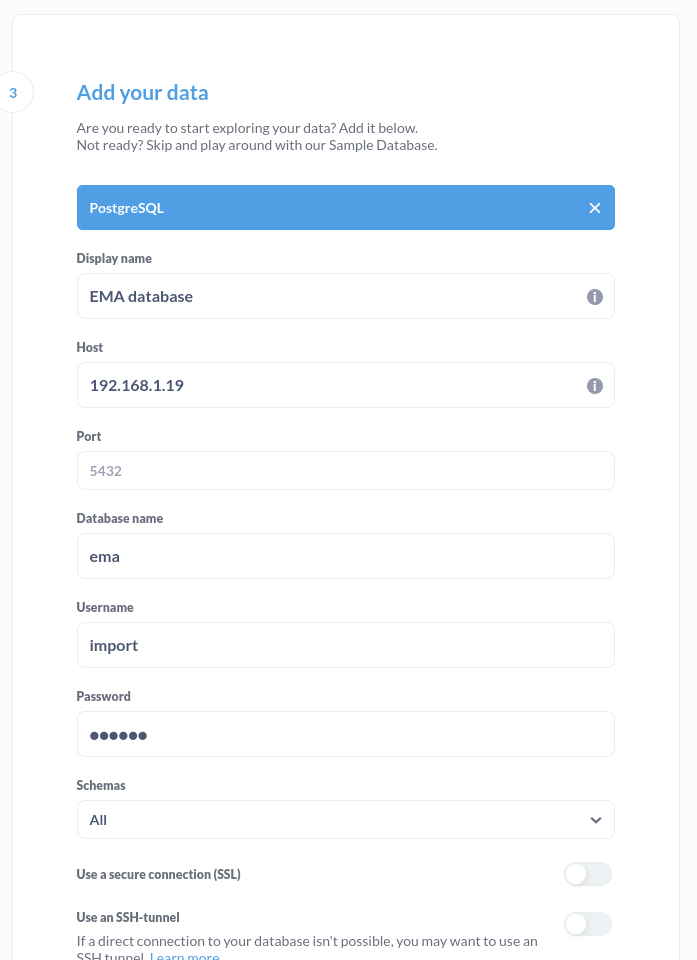
When finished, press the Connect database button.
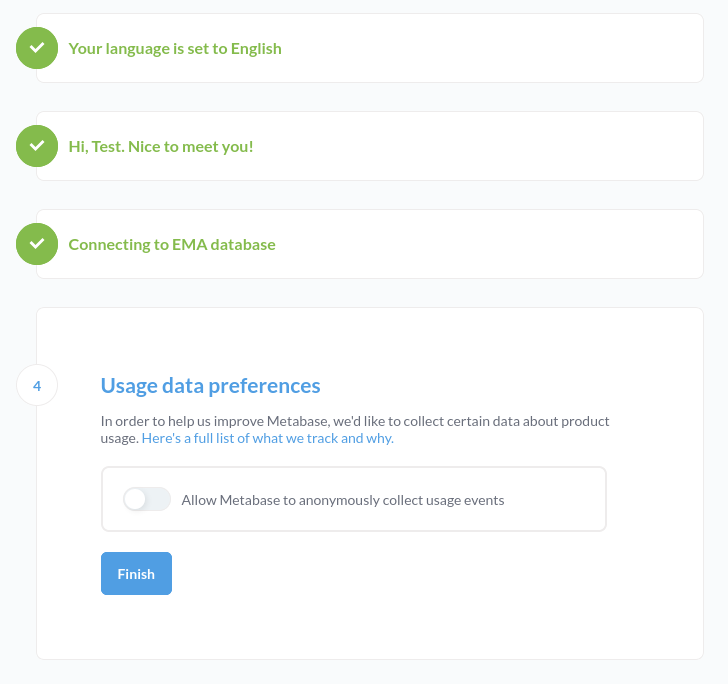
If all went well, you should see Step 4 showing a Finish button. We decided to disallow Metabase to anonymously collect usage events.
You can then decide to sign up for a the Metabase newsletter, but we skip it and press the Take me to Metabase button.
If all went well, you should have a Metabase dashboard like the next picture. You can press the buttons in the dashboard to get some general insights into our database.
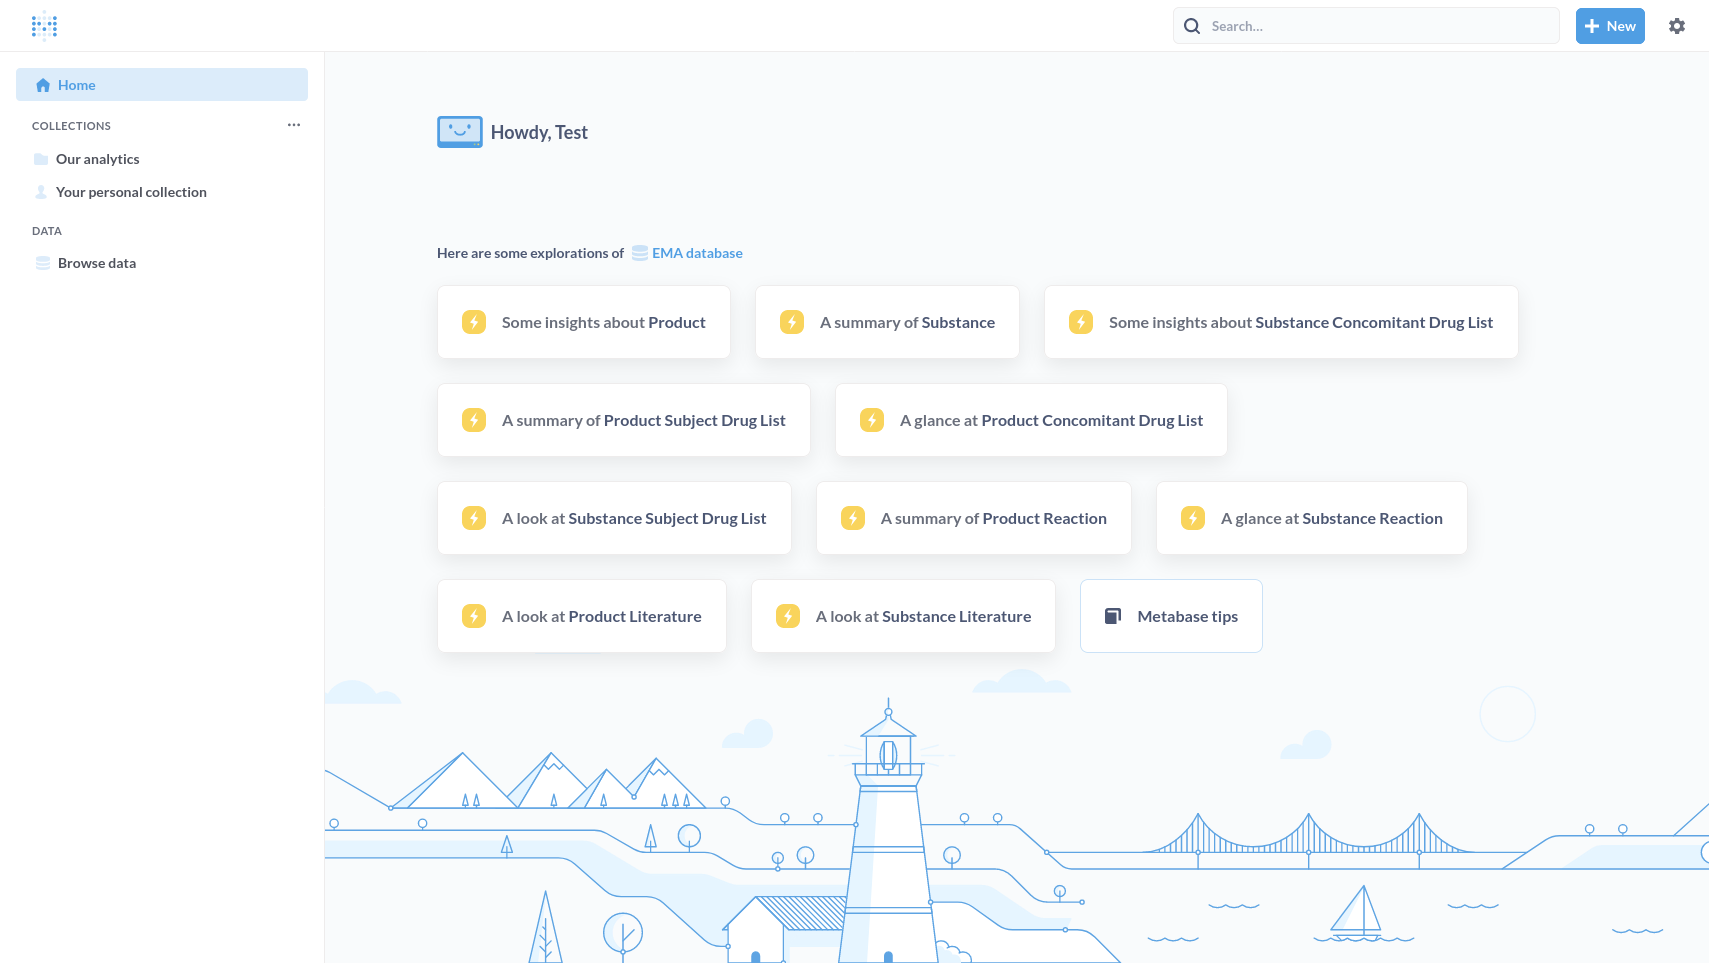
The Metabase dashboard will be used throughout the visualisation chapter. More information on Metabase can be found in the Documentation section of the Metabase website
Add the map of Europe
If you want to visualise data on a map, you can use this Map of Europe with which it is possible to attach the country field from the tables in the public namespace as shown in the example below.
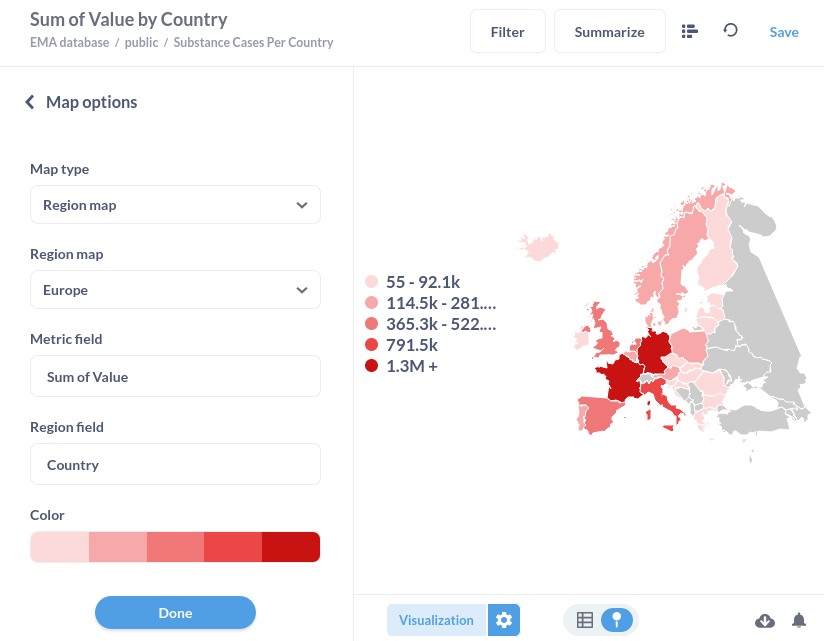
Substance
In the visualisation chapter for substances we will visualise the queries we ran in the analyses chapter.
Substance top-10
In Metabase, select the EMA database from the Home page clicking the link.

You will be taken to a page that shows all the tables in the database.

Click the Substance button. You should now see the Substance table.
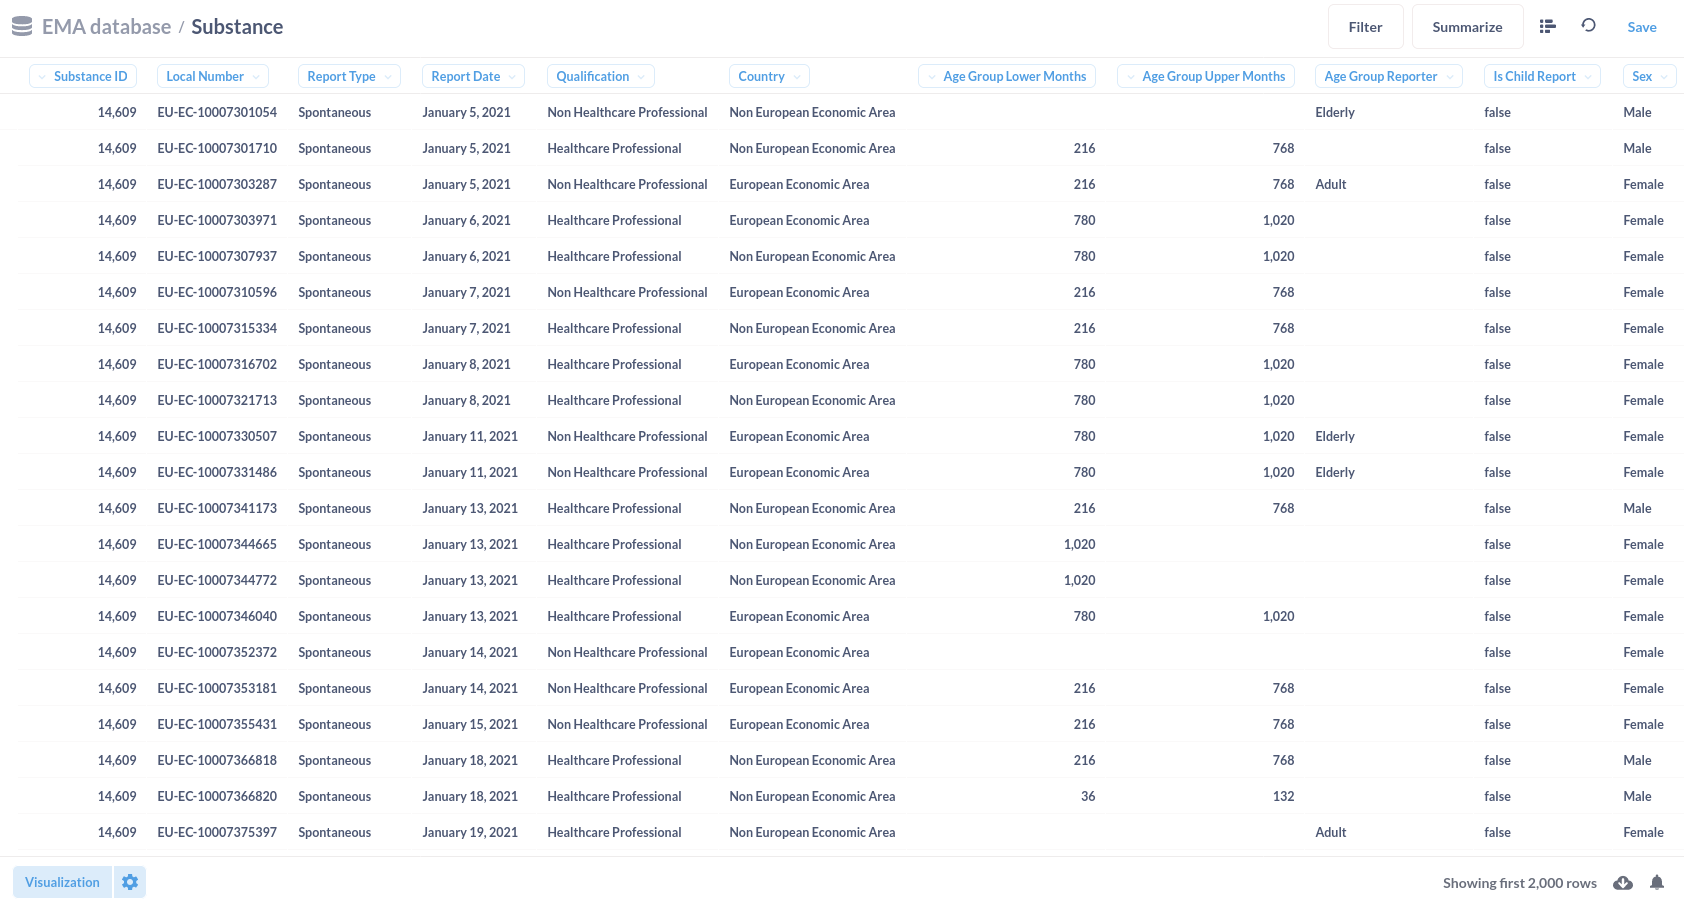
We press the + New button in the top right of the screen and select SQL query.
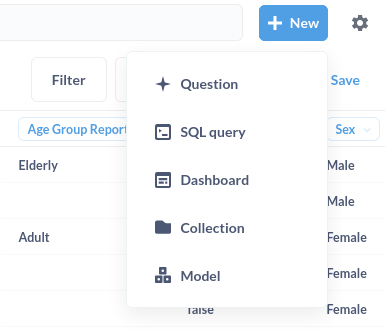
And end up with a blank sheet
In the input area of the page, we enter the query that we find at analyses - substances - substance top-10
And press the blue play button in the lower right corner.
A screen appears showing that the data is being loaded (doing science).

When the query finishes running, your screen should show the query in the top section and a table in the bottom section like in the next screenshot.
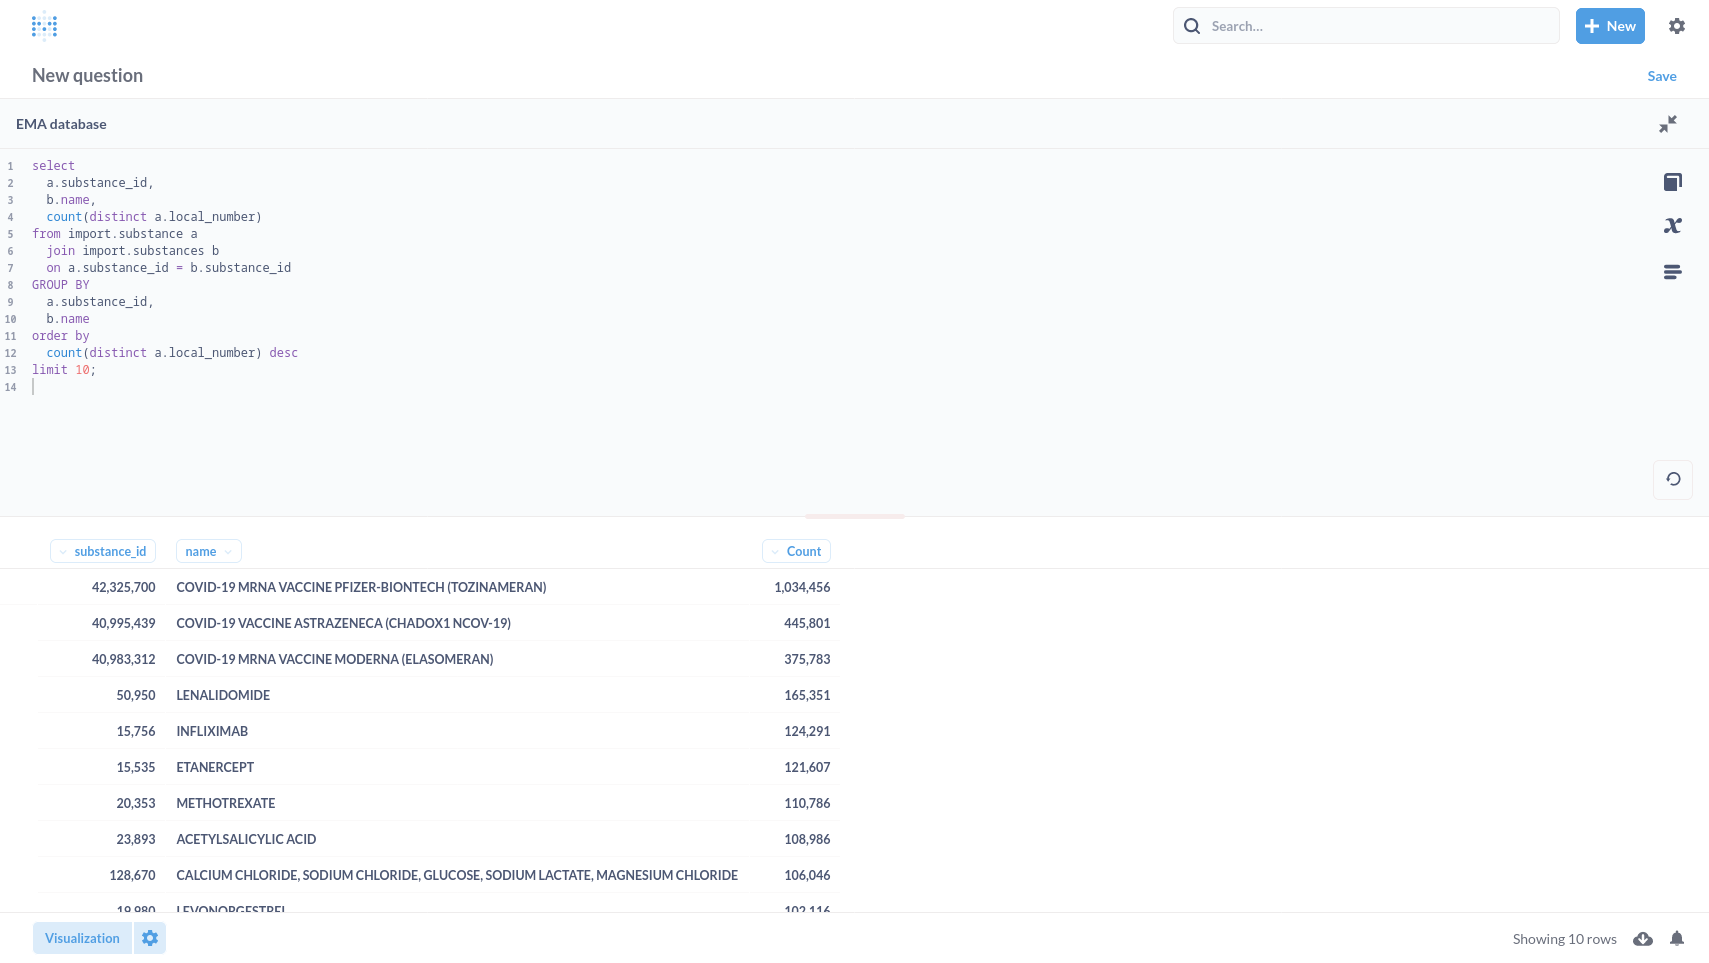
You can now select the Visualization button that opens a side panel.
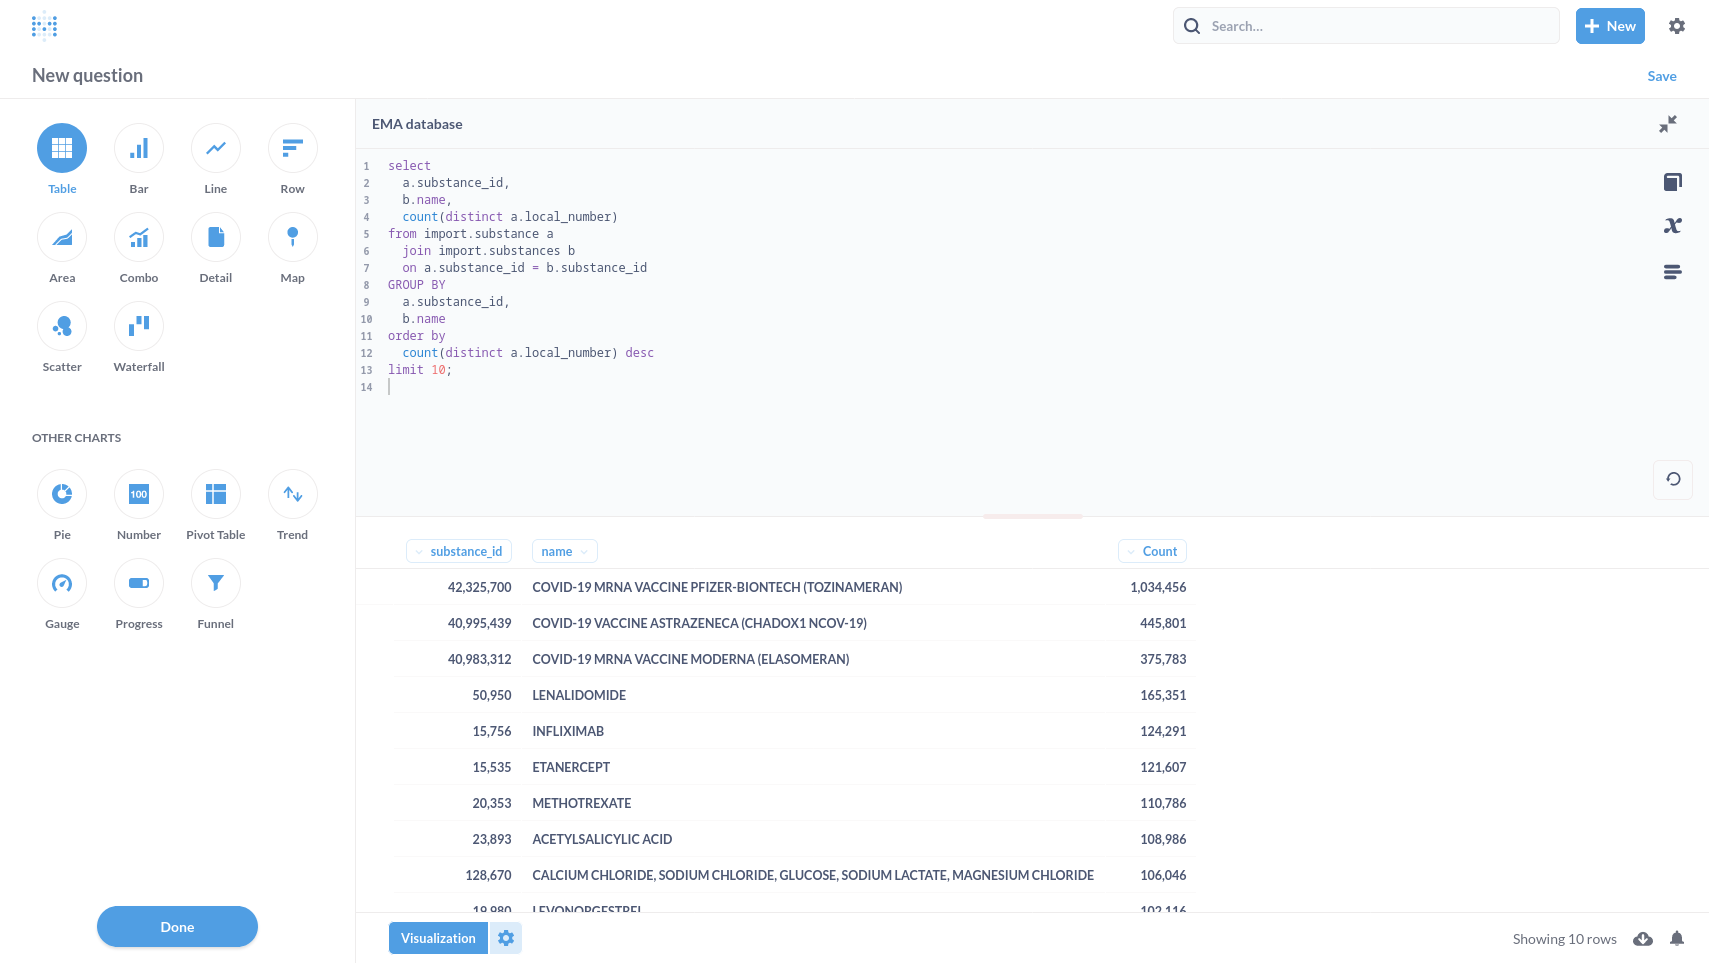
Select the Row visualisation to get the picture shown below.

If you hover your mouse over the now selected Row button, you will see a cog symbol appear. Click it. A new side panel opens with Row options
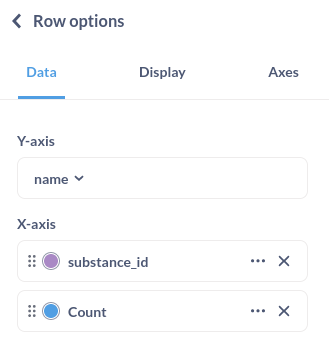
Remove the substance_id from the X-axis
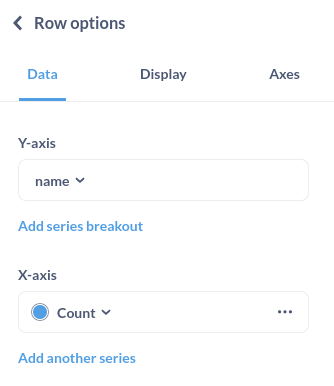
You will see the visualisation change, now showing the substance top-10 in a horizontal row chart.

Substance reports per month
In Metabase, select the EMA database from the Home page clicking the link.

You will be taken to a page that shows all the tables in the database.

Click the Substance button. You should now see the Substance table.

Press the Report Date button above the column showing the dates and select Distribution
Metabase should render a line graph.
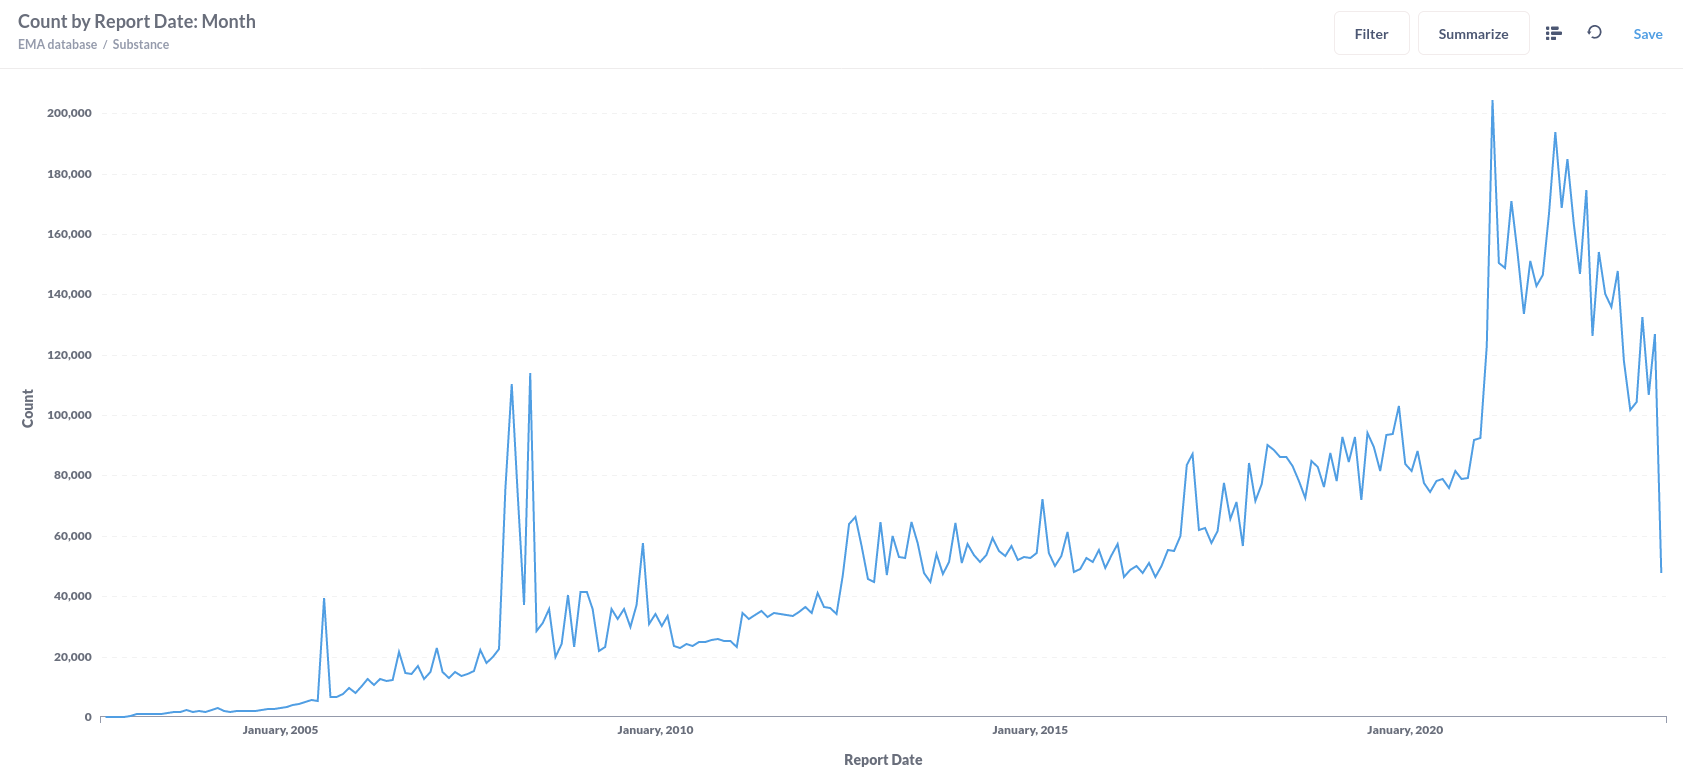
Substance reaction per month
In Metabase, select the EMA database from the Home page clicking the link.

You will be taken to a page that shows all the tables in the database.

Click the Substance Reaction button. You should now see the substance_reaction table.
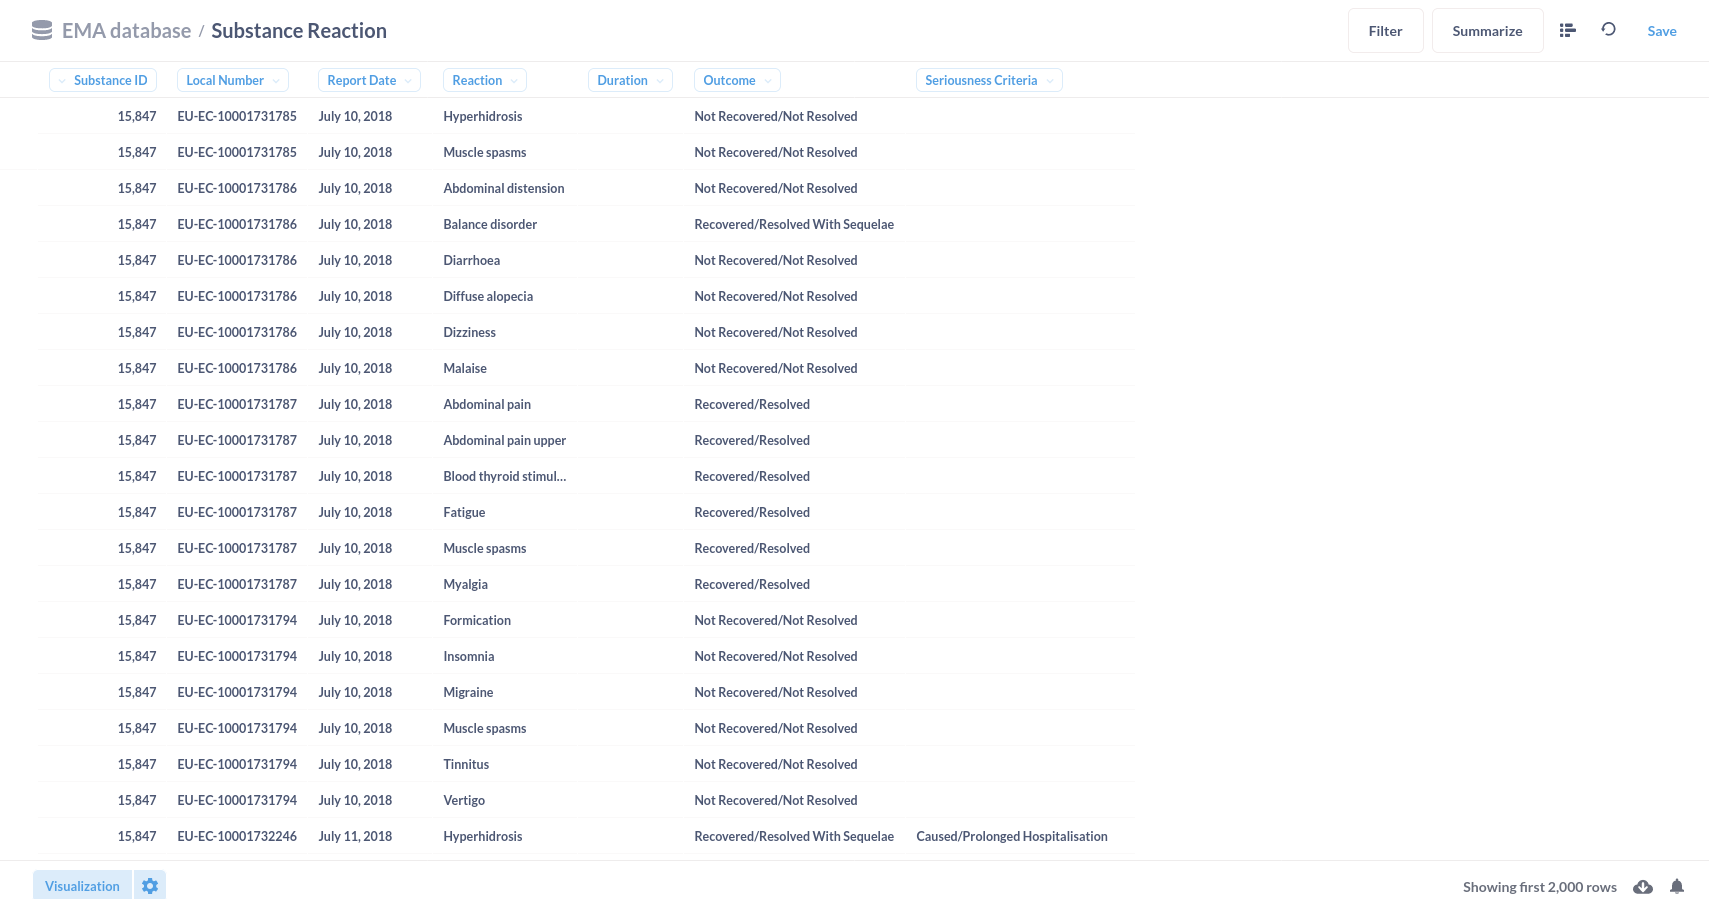
Press the Summarize button in the top right corner. In the side panel that opens, Make sure that it the Count button is green. Hover over the report data and change the value by day to by month. Now hover over Outcome to see a + appear to add grouping. Click it.
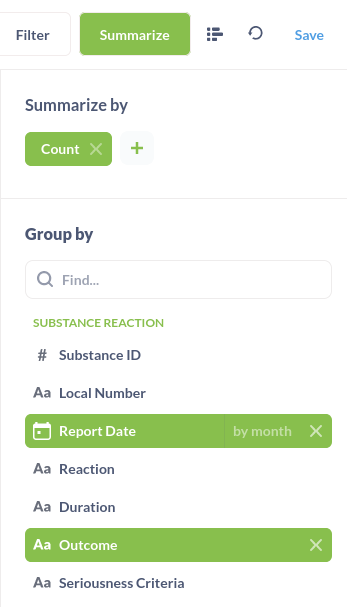
We need a filter, to hide the line with the empty outcome. Press Filter in the top right. A screen will pop up where we will select "Outcome Not empty" as shown in the next screenshot. When done, press Apply Filters
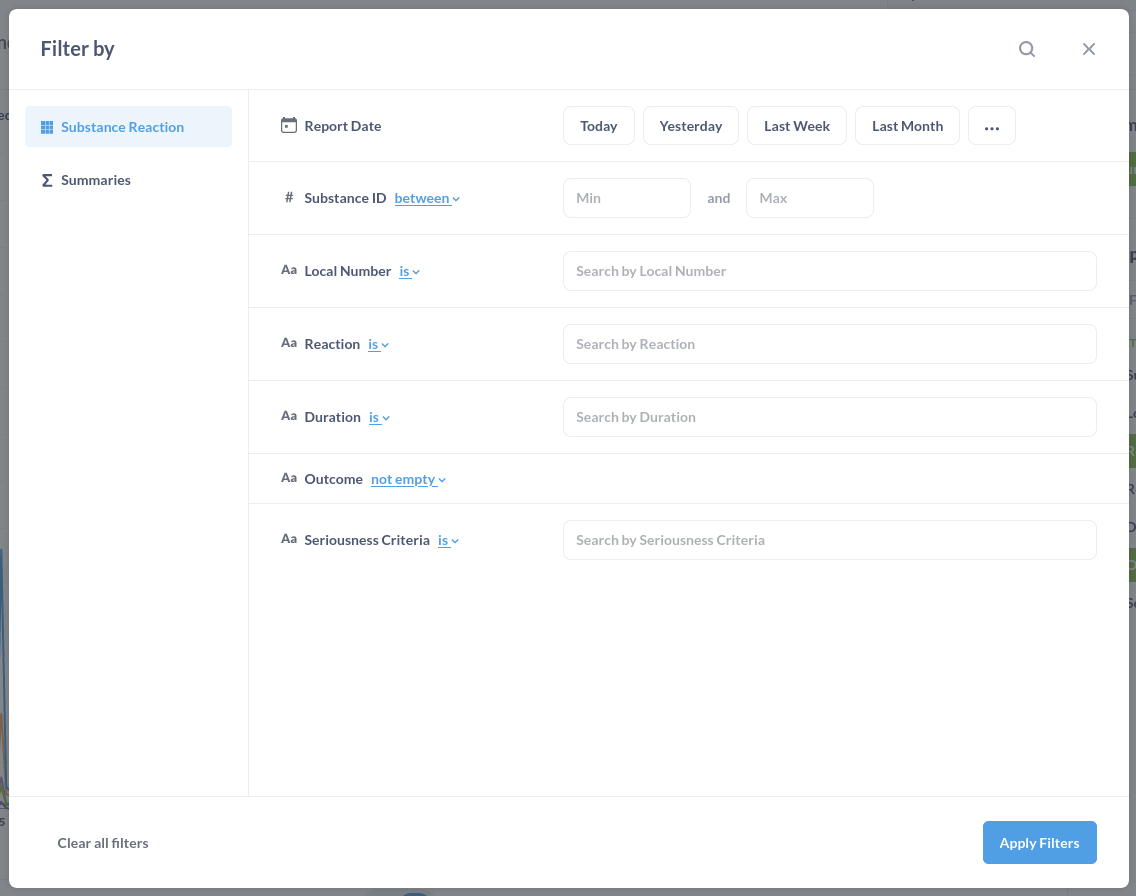
After Metabase retrieves the results from the database, the display should look like the next screenshot.

Metabase offers a variety of options to tweak the visualisation. We replaced COUNT with Distinct values of Local Number which takes a while to render but makes sure only one instance of each report version is used in the visualisation. Since a lot of reports are connected to multiple substances, the Y-axis maximum value changes from 280000 to 90000. Make sure you use distinct reports in your visualisations too!
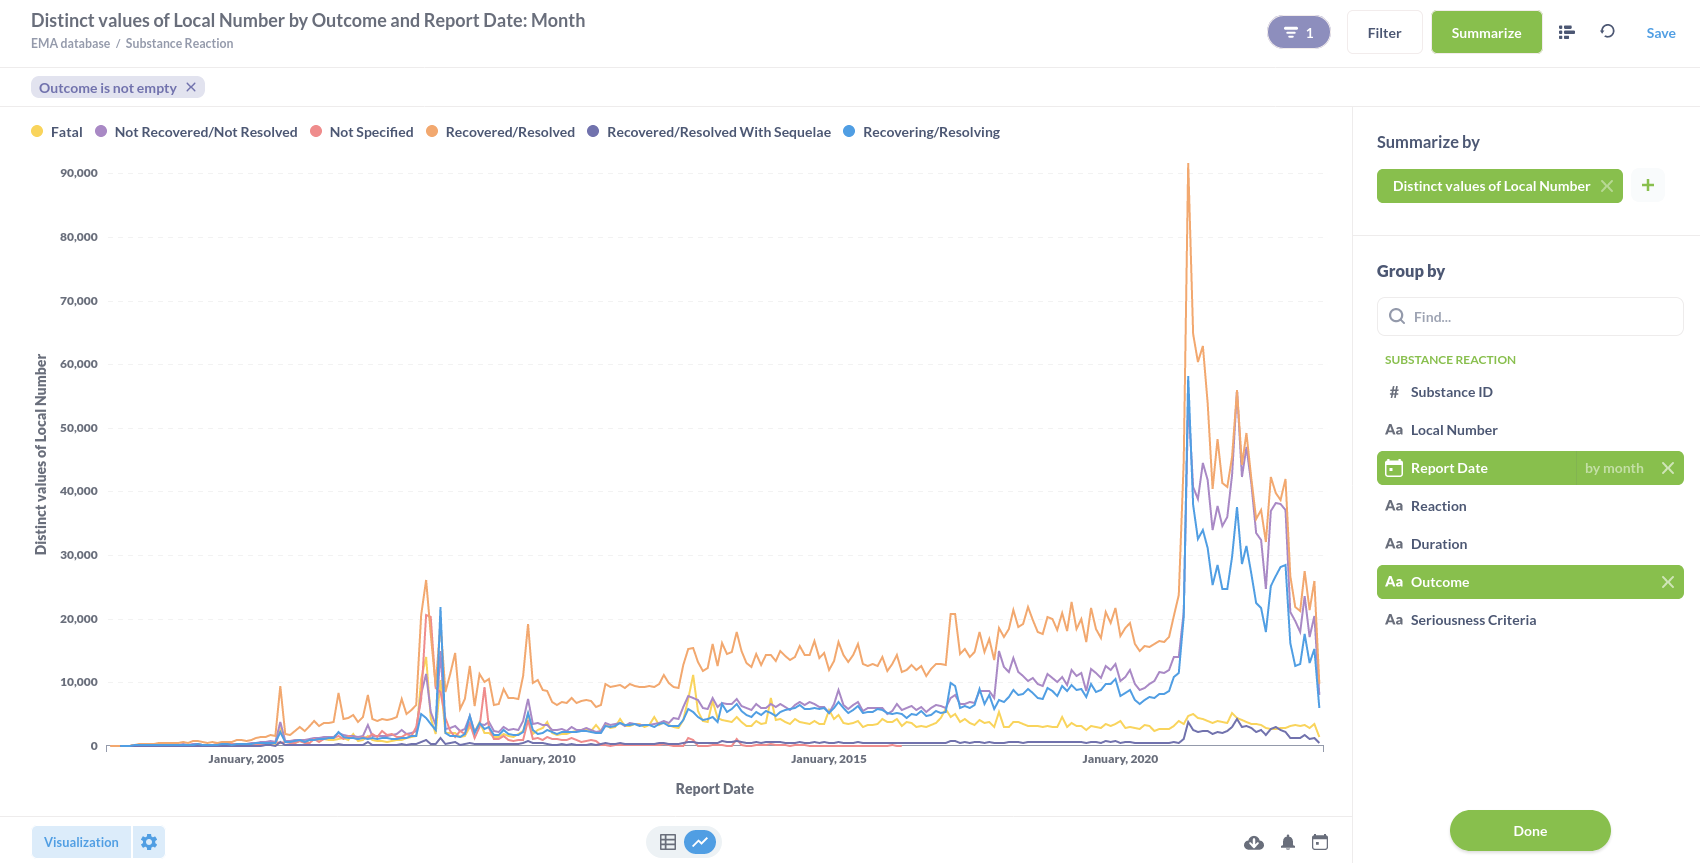
We notice a sharp increase sometime after the start 2020. When we zoom in to January 2020 to July 2023, we get a more detailed view of what is happening.
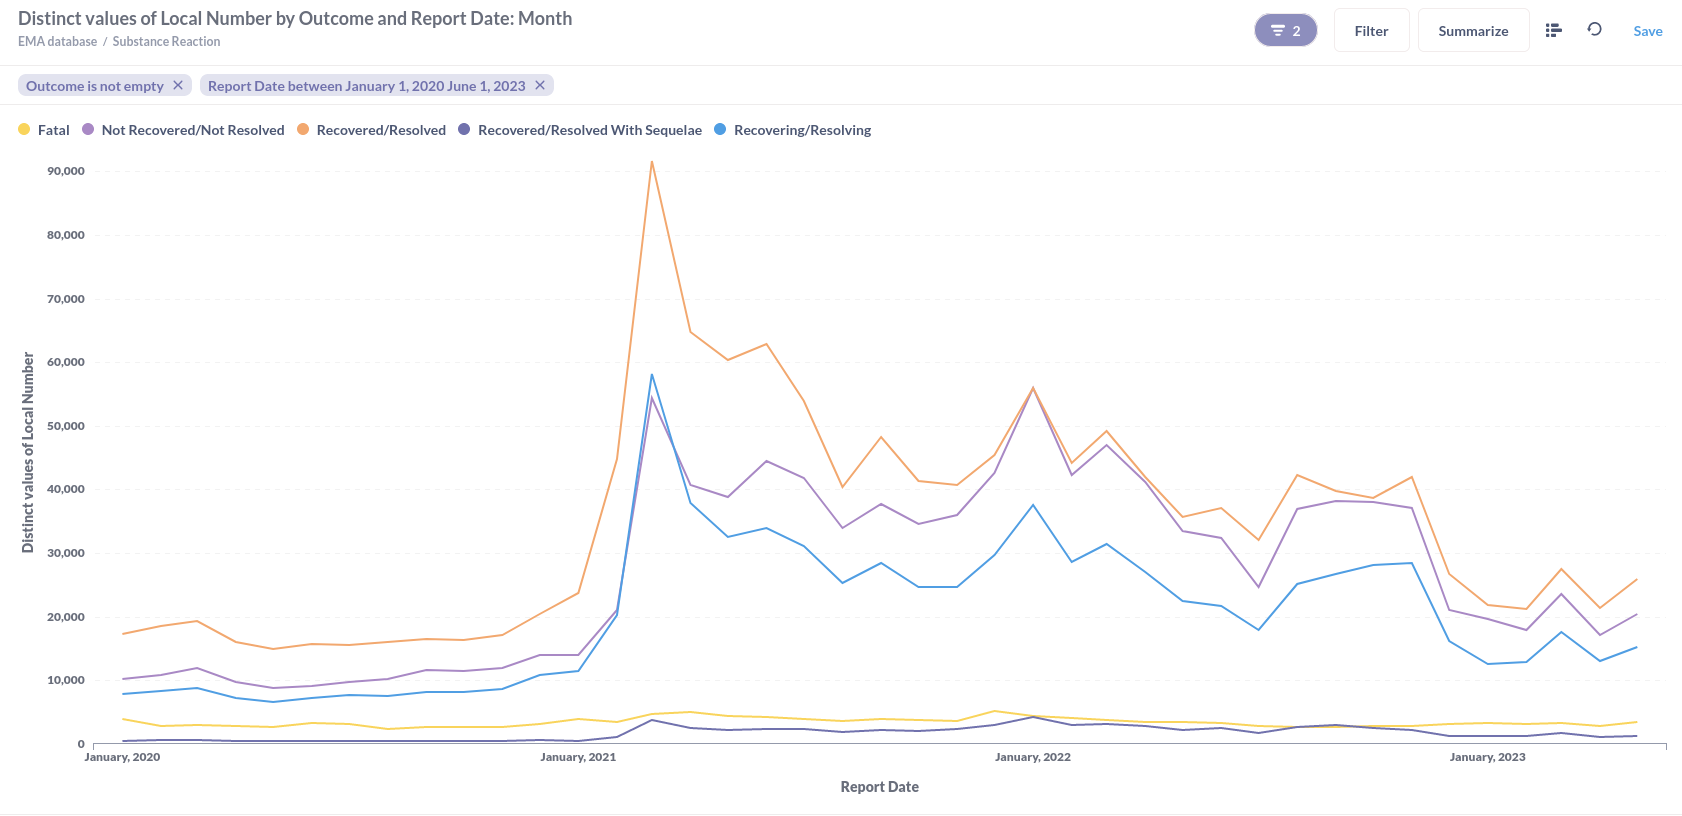
In the zoomed in picture, we can see that from January 2021, the total number of reports explodes and then slowly decreases, but the number of reports that result in Fatal and Recovered/Resolved With Sequelae differ in the hundreds which make their line appear flat. Let's isolate these two lines by turning the others off. This can be done from the left side panel that opens when we press the Visualization button and select the Cog symbol in the upper right corner of on the Line Graph button that appears when we hover that button.
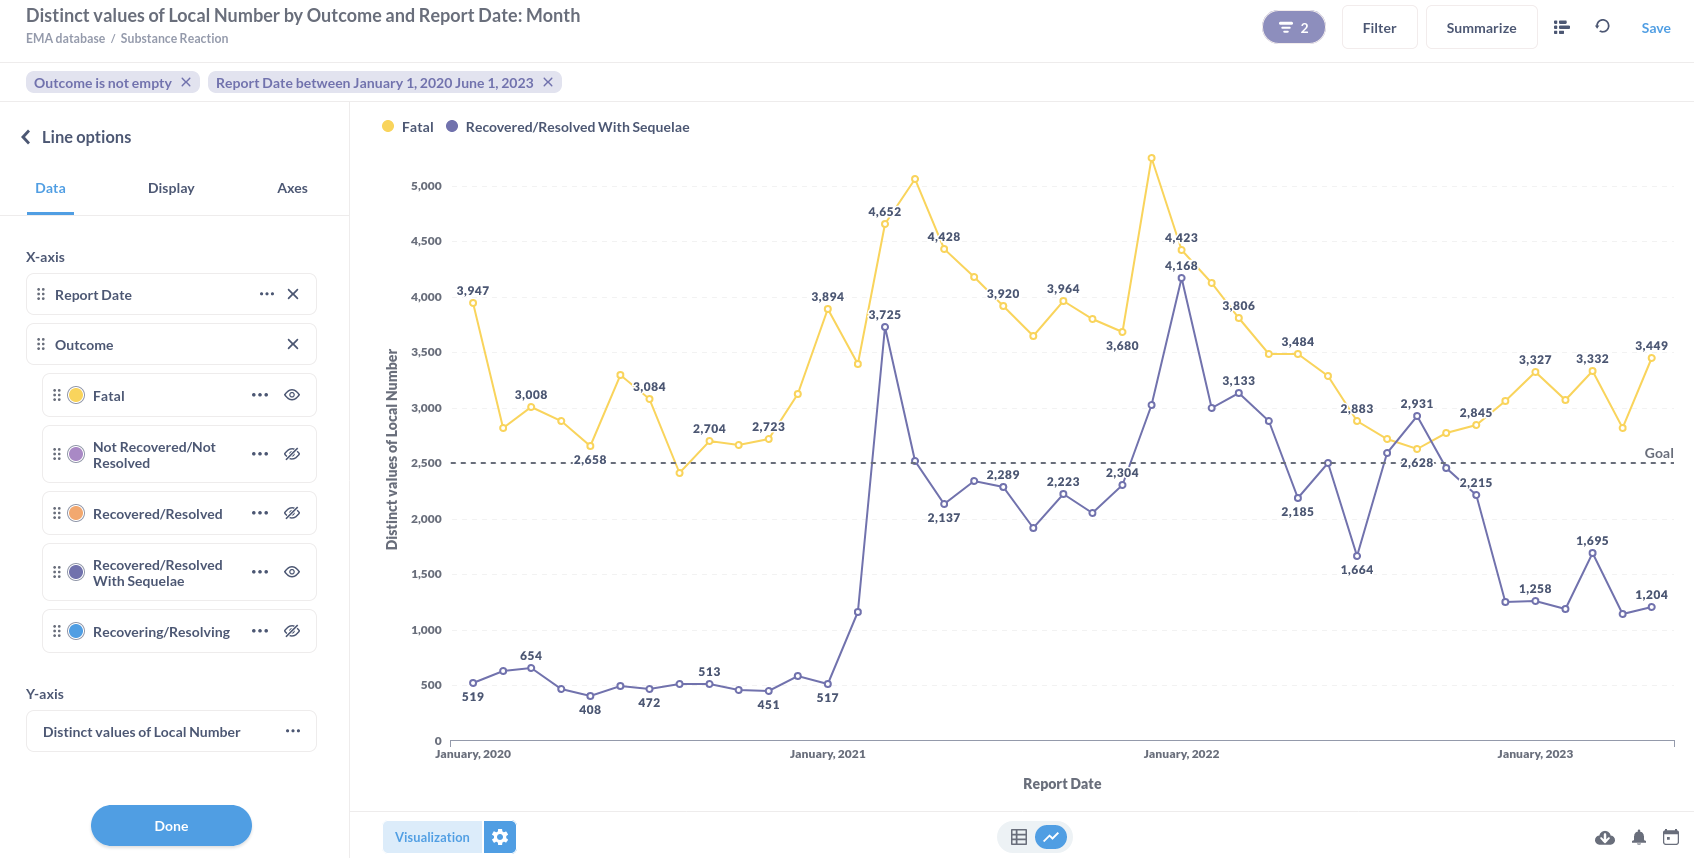
The number of reports with Fatal outcome fluctuate, but stay above 2417 for this period in time. If we take the whole period of the database, we see two peak periods in reports with Fatal outcome; February to June 2008 and September 2012 to January 2012. We can also see that after February 2011 the reports with Fatal outcome no longer drop below 2417 until the end of the total dataset.
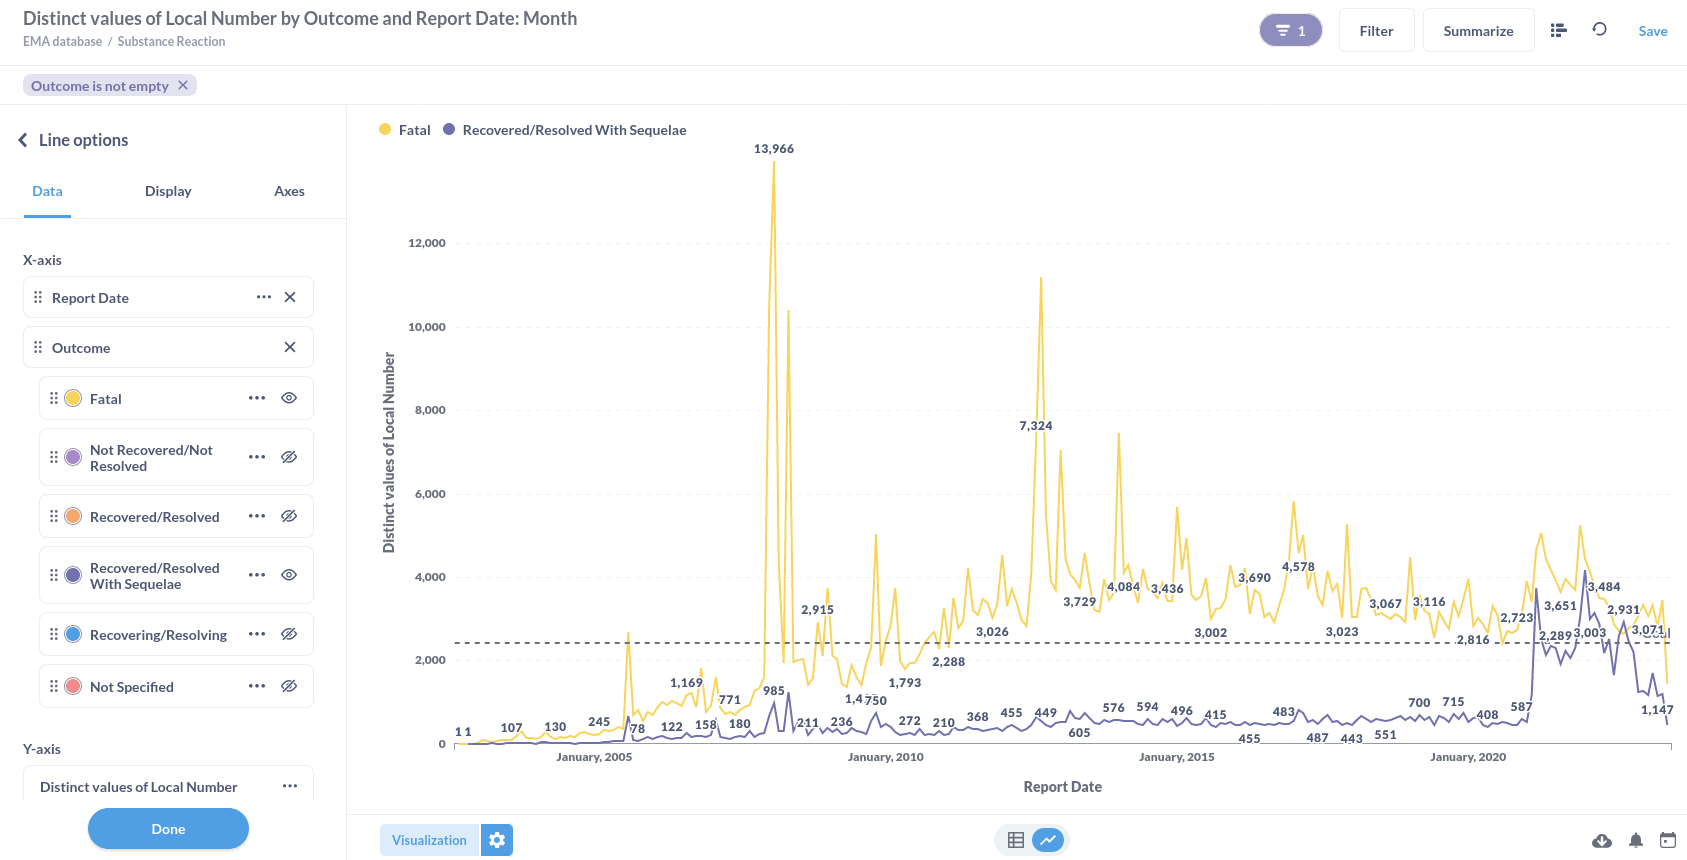
We strongly encourage everyone to create their own visualisation and describe their choices so results can be reproduced and discussed.
Product
In the visualisation chapter for products we will visualise the queries we ran in the analyses chapter for products.
Product reaction per year
In Metabase, select the EMA database from the Home page clicking the link.

You will be taken to a page that shows all the tables in the database.

We created the following visualisation where we:
- Summarized by Distinct values of Local Number
- Grouped by Outcome
- Aggregated the Report date by year
The screenshot shows the result, we challenge you to create a similar presentation.
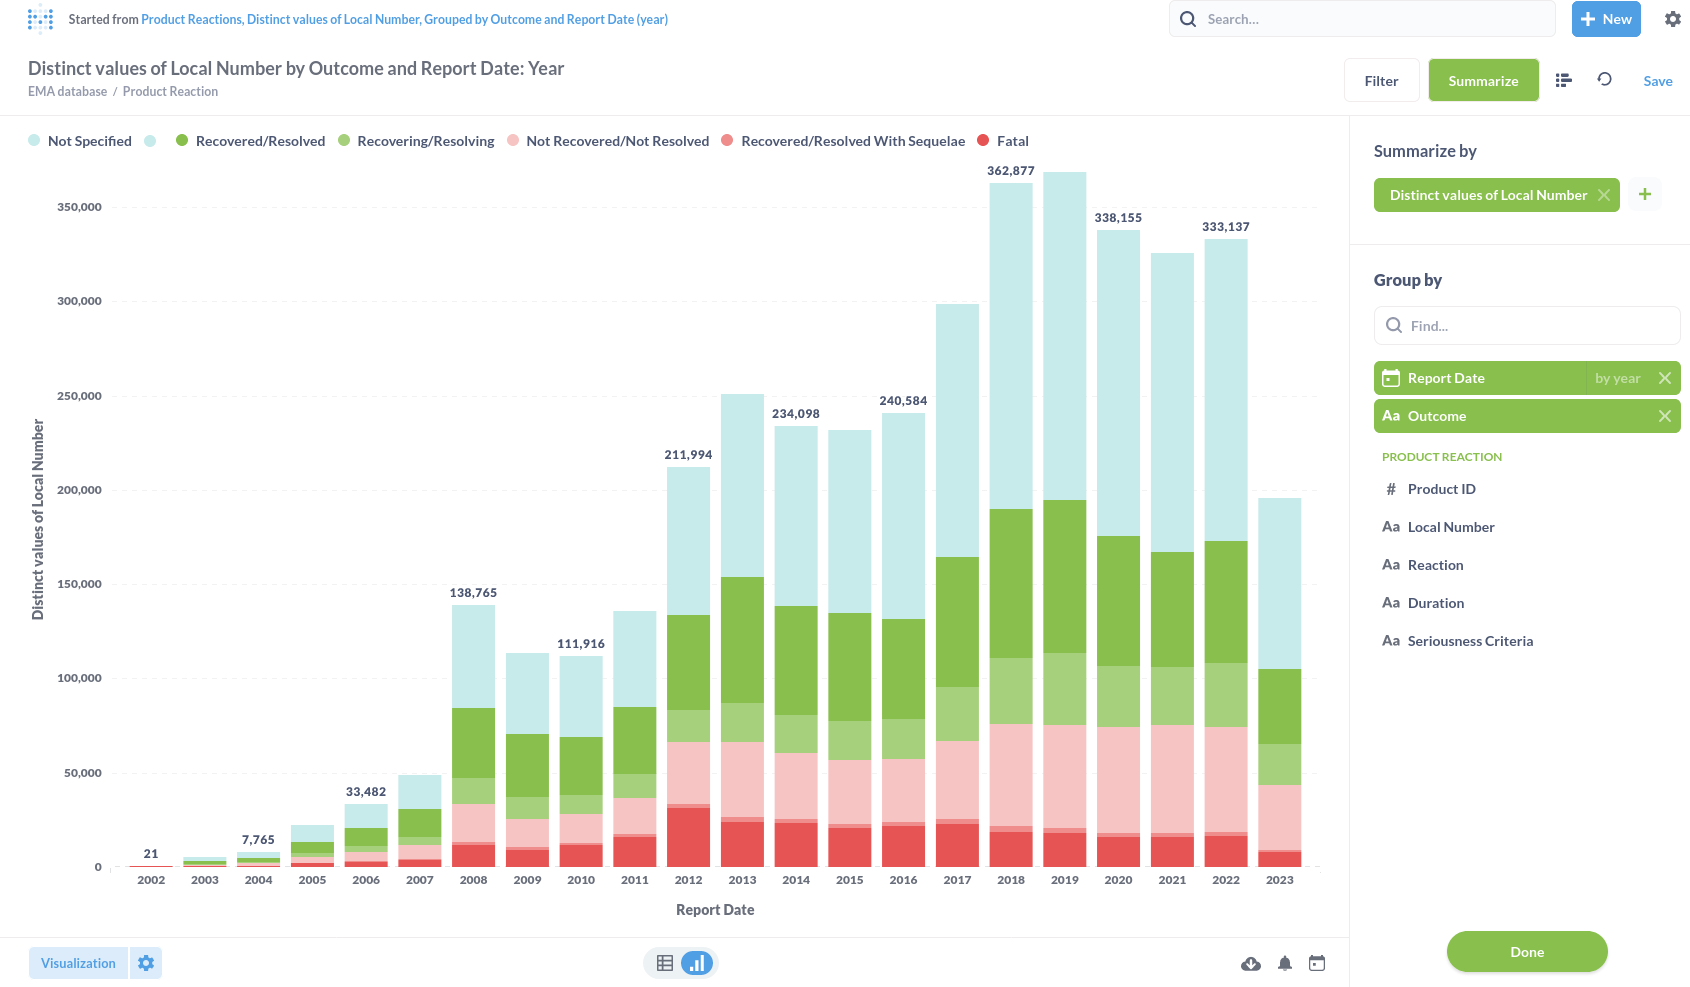
We changed the sequence of the results and changed the colors for the bars in the left panel.
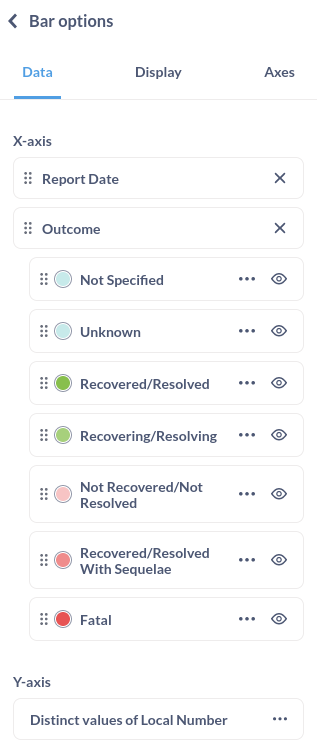
Did you manage to get the same presentation? Let's look at it in detail and draw example conclusions.
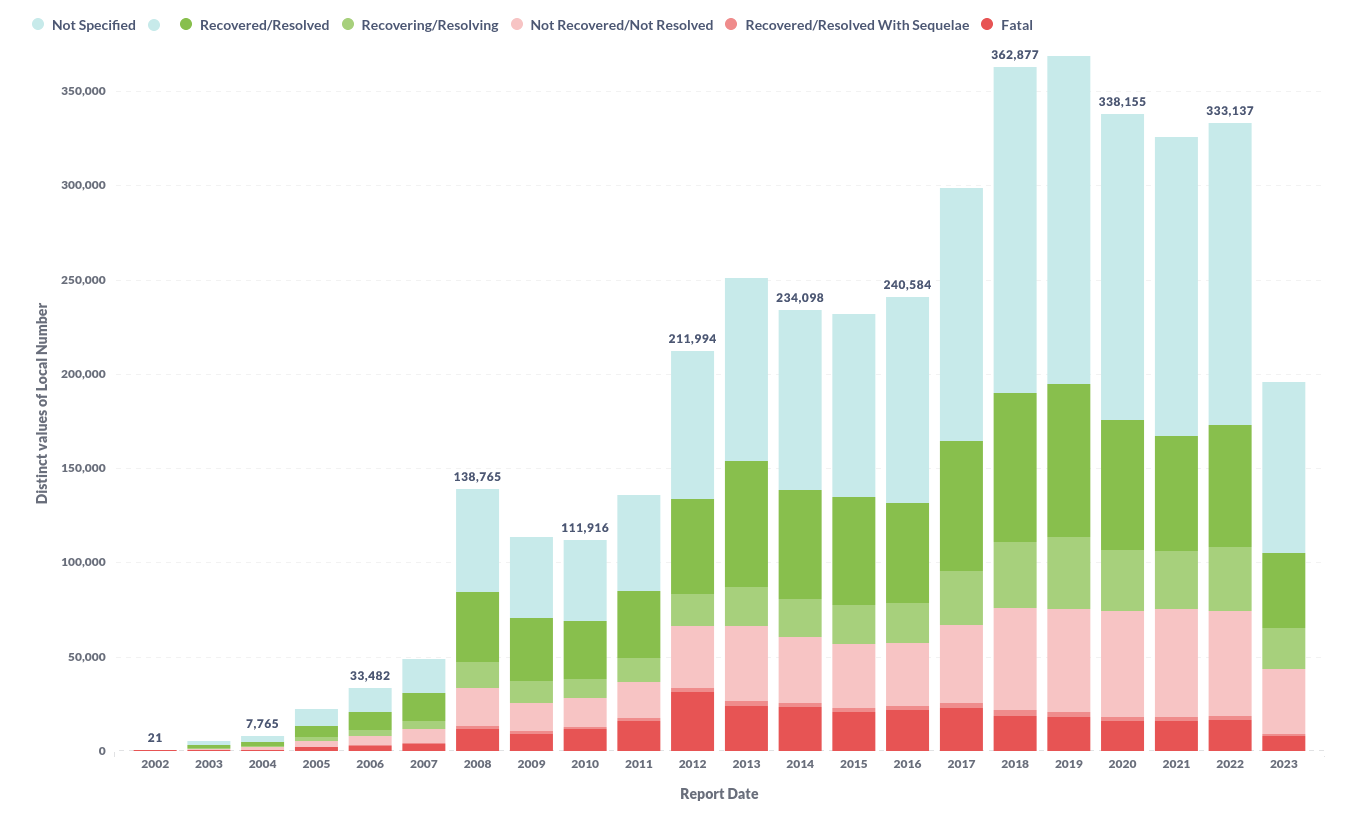
A couple of things we notice:
- The number of reports on product with a Fatal outcome seems to be stable or even decline a little.
- The number of reports on product that have an unspecified or unset outcome has been rising and kept rising until 2020 to drop a little from there.
- The number of reports on product is declining since 2020
- The number of reports on product with outcome Recovering/Resolving and Recovered/Resolved has been rising, but is declining since 2020.
Can you think of more advanced uses? We welcome discussion and suggestions, also about misinterpretation. Let us know!
Glossary
More terms are explained in the adrreports.eu Glossary
Adverse Drug Reaction Report (Adrr)
The adrreports.eu portal provides public access to reports of suspected side effects submitted to the EudraVigilance system by national medicines regulatory authorities and pharmaceutical companies that hold marketing authorisations for medicines in the European Economic Area (EEA).
see: Adrreports.eu
Concomitant
Synonym for "accompanying". A descendant of Latin concomitari ("to accompany") and ultimately of "comes," the Latin word for companion.
source: Merriam Webster Dictionary
Drug
Synonym for Medicine as stated on Adrreports.eu: "Centrally authorised medicine or non-centrally authorised medicine"
"For centrally authorised medicines, access to reports is granted both by the name of the medicine or the name of the active substance. For non-centrally authorised medicines, access is granted based on the name of the active substance only."
As an example: the most reported substance we find in the database is Tozinameran, Comirnaty is the product it is used in, BioNTech/Pfizer-vaccin is the drug that would be administered.
_see: Adrreports.eu (EN)
Drug List
Information that shows characterisation of ‘Drug Role’, defined as suspect, interacting, concomitant or drug not administered. Based on this data element, 2 different ‘Drug’ (medicines) lists will be created, for suspect and interacting drugs and for concomitant or drug not administered. Reported medicinal product, displayed as recoded against the Extended EudraVigilance Medicinal Product Dictionary for centrally authorised products (for non-centrally authorised products, only the recoded substance will be displayed where reported). Substance / Specified Substance Name, displayed as recoded against the Extended EudraVigilance Medicinal Product Dictionary (if not, it will be displayed as reported). Indication of the medicinal product described as MedDRA Preferred Term. ‘Duration of Drug Administration’, as reported or based on ‘Drug Administration Start Date’ and ‘End Date’, Dose of the medicine and Route of administration of the medicine.
source: Web Report User Guide
EMA
Abbreviation for "European Medicine Agency".
"The European Medicines Agency (EMA) is a decentralised agency of the European Union (EU). It began operating in 1995. The Agency is responsible for the scientific evaluation, supervision and safety monitoring of medicines in the EU."
source: EMA website
EudraVigilance
"The system for managing and analysing information on suspected adverse reactions to medicines which have been authorised or being studied in clinical trials in the European Economic Area (EEA). The European Medicines Agency (EMA) operates the system on behalf of the European Union (EU) medicines regulatory network."
source: EMA Website, EudraVigilance
Line listing
Data downloaded from the EudraVigilance webpage.
"The data and information provided at substance level is in the form of an electronic Reaction Monitoring Report (eRMR) containing aggregated data and a line listing with details of the individual cases. Users are also able to retrieve Individual Case Safety Report (ICSRs) forms accessible through the line listing."
see: EudraVigilance User Manual Marketing Authorisation Holders
Local number
The local number is the unique identifier also known as "Case Identifier format" as stated on page 89, #12 of the EU Individual Case Safety Report (ICSR)¹ Implementation Guide. It consists of
"Country code" followed by a dash, "organisation ID or name" followed by a dash and "local system number"
f.i.
EU-EC-2950025
In the public EMA database, Country code has been replaced by EU and organisation ID by EC (abbr. for European Commission) for all the reports.
mdbook
A tool used for generating documentation from markdown files. mdbook documentation website
Postgresql
The database system we use. PostgreSQL website
Report
Used throughout this documentation as synonym for ICSR or Individual Case Safety Report.
"Used for reporting to the EudraVigilance database suspected adverse reactions to a medicinal product that occur in a single patient at a specific point in time"
see: EU Individual Case Safety Report (ICSR)¹ Implementation Guide
SQL
"A domain-specific language used in programming and designed for managing data held in a relational database management system (RDBMS), or for stream processing in a relational data stream management system (RDSMS). It is particularly useful in handling structured data, i.e., data incorporating relations among entities and variables."
source: Wikipedia
Drug List
Information that shows characterisation of ‘Drug Role’, defined as suspect, interacting, concomitant or drug not administered. Based on this data element, 2 different ‘Drug’ (medicines) lists will be created, for suspect and interacting drugs and for concomitant or drug not administered. Reported medicinal product, displayed as recoded against the Extended EudraVigilance Medicinal Product Dictionary for centrally authorised products (for non-centrally authorised products, only the recoded substance will be displayed where reported). Substance / Specified Substance Name, displayed as recoded against the Extended EudraVigilance Medicinal Product Dictionary (if not, it will be displayed as reported). Indication of the medicinal product described as MedDRA Preferred Term. ‘Duration of Drug Administration’, as reported or based on ‘Drug Administration Start Date’ and ‘End Date’, Dose of the medicine and Route of administration of the medicine.
source: Web Report User Guide
Database schema
Country data
Table "public.product_cases_per_country"
| Column | Type | Collation | Nullable | Default |
|---|---|---|---|---|
| high level code | bigint | |||
| country | text | |||
| value | bigint |
Table "public.substance_cases_per_country"
| Column | Type | Collation | Nullable | Default |
|---|---|---|---|---|
| high level code | bigint | |||
| country | text | |||
| value | bigint |
Line Listings
All line listings contain field names on the first row. These field names are mapped to convenient database table column names for better readability. This table contains the mapping of the fields to columns plus a description.
| CSV field name | Database column name | Description |
|---|---|---|
| EU Local Number | local_number | The identifier of the individual case safety repport (ICSR) |
| Report Type | report_type | the value of this field is always "Spontanous" |
| EV Gateway Receipt Date | report_date | Date/time the report was issued |
| Primary Source Qualification | qualification | Can be "Healthcare Professional", "Non Healthcare Professional" or "Not Specified" |
| Primary Source Country for Regulatory Purposes | country | Can be "European Economic Area" "Non European Economic Area" or "Not Specified" |
| Literature Reference | table import.___literature | |
| Patient Age Group | age_group_lower_months age_group_upper_months | split in lower and upper values in months as this is the lowest resolution present f.i. for children aged 0 to 2 months. Calculating the lower and upper age value allows measuring withing groups as the age groups are sometimes shifted. |
| Patient Age Group (as per reporter) | N/A | All rows in the CSV files contained the value "Not specified" so we skipped it |
| Parent Child Report | is_child_report | Can be true or false |
| Patient Sex | sex | Can be "Female" or "Male" |
| Reaction List PT (Duration – Outcome - Seriousness Criteria) | table import.___reaction | |
| Suspect/interacting Drug List (Drug Char - Indication PT - Action taken - [Duration - Dose - Route]) | table import.___subject_drug_list | |
| Concomitant/Not Administered Drug List (Drug Char - Indication PT - Action taken - [Duration - Dose - Route]) | table import.___concomitant_drug_list | |
| ICSR Form | N/A | Skipped because it can be reconstructed from the local_number |
Products
Table "import.products"
This table contains the product_id used in the other product related tables and queries and a human readable name.
| Column | Type | Collation | Nullable | Default |
|---|---|---|---|---|
| product_id | bigint | |||
| name | text |
Table "import.product"
| Column | Type | Collation | Nullable | Default |
|---|---|---|---|---|
| product_id | integer | |||
| local_number | character varying | |||
| report_type | character varying | |||
| report_date | date | |||
| qualification | character varying | |||
| country | character varying | |||
| age_group_lower_months | smallint | |||
| age_group_upper_months | smallint | |||
| age_group_reporter | character varying | |||
| is_child_report | boolean | |||
| sex | character varying | |||
| serious | boolean |
Table "import.product_reaction"
| Column | Type | Collation | Nullable | Default |
|---|---|---|---|---|
| product_id | integer | |||
| local_number | character varying | |||
| report_date | date | |||
| reaction | character varying | |||
| duration | character varying | |||
| outcome | character varying | |||
| seriousness_criteria | character varying |
Table "import.product_literature"
| Column | Type | Collation | Nullable | Default |
|---|---|---|---|---|
| product_id | integer | |||
| local_number | character varying | |||
| report_date | date | |||
| literature | character varying |
Table "import.product_concomitant_drug_list"
| Column | Type | Collation | Nullable | Default |
|---|---|---|---|---|
| product_id | integer | |||
| local_number | character varying | |||
| report_date | date | |||
| drugs | character varying | |||
| characteristic | character varying | |||
| indication | character varying | |||
| action | character varying | |||
| duration | character varying | |||
| dose | character varying | |||
| route | character varying |
Table "import.product_subject_drug_list"
| Column | Type | Collation | Nullable | Default |
|---|---|---|---|---|
| product_id | integer | |||
| local_number | character varying | |||
| report_date | date | |||
| drugs | character varying | |||
| characteristic | character varying | |||
| indication | character varying | |||
| action | character varying | |||
| duration | character varying | |||
| dose | character varying | |||
| route | character varying |
Substances
Table "import.substances"
This table contains the substance_id used in the other substance related tables and queries and a human readable name.
| Column | Type | Collation | Nullable | Default |
|---|---|---|---|---|
| substance_id | bigint | |||
| name | text |
Table "import.substance"
| Column | Type | Collation | Nullable | Default |
|---|---|---|---|---|
| substance_id | integer | |||
| local_number | character varying | |||
| report_type | character varying | |||
| report_date | date | |||
| qualification | character varying | |||
| country | character varying | |||
| age_group_lower_months | smallint | |||
| age_group_upper_months | smallint | |||
| age_group_reporter | character varying | |||
| is_child_report | boolean | |||
| sex | character varying | |||
| serious | boolean |
Table "import.substance_reaction"
| Column | Type | Collation | Nullable | Default |
|---|---|---|---|---|
| substance_id | integer | |||
| local_number | character varying | |||
| report_date | date | |||
| reaction | character varying | |||
| duration | character varying | |||
| outcome | character varying | |||
| seriousness_criteria | character varying |
Table "import.substance_literature"
| Column | Type | Collation | Nullable | Default |
|---|---|---|---|---|
| substance_id | integer | |||
| local_number | character varying | |||
| report_date | date | |||
| literature | character varying |
Table "import.substance_concomitant_drug_list"
| Column | Type | Collation | Nullable | Default |
|---|---|---|---|---|
| substance_id | integer | |||
| local_number | character varying | |||
| report_date | date | |||
| drugs | character varying | |||
| characteristic | character varying | |||
| indication | character varying | |||
| action | character varying | |||
| duration | character varying | |||
| dose | character varying | |||
| route | character varying |
Table "import.substance_subject_drug_list"
| Column | Type | Collation | Nullable | Default |
|---|---|---|---|---|
| substance_id | integer | |||
| local_number | character varying | |||
| report_date | date | |||
| drugs | character varying | |||
| characteristic | character varying | |||
| indication | character varying | |||
| action | character varying | |||
| duration | character varying | |||
| dose | character varying | |||
| route | character varying |
Contact
We are working on a community platform. In the meanwhile, you can reach us by email at community@open-ema.eu or open an issue in our repository. To create issues on gitlab, you need a gitlab account. Please read the gitlab privacy statement for details about your account.
OpenEMA takes the PUBLICLY available data from EudraVigilance and makes it more user friendly. We are a PRIVATE entity, not affiliated with EMA.
About
The internet domain OpenEMA.org hosts a community supported open source project and is not affiliated in any way with any European Union Agency. The website documents how publicly available data can be opened and analysed, such as it is presented to Healthcare Professionals and the Public on the EMA adrreports.eu portal.
In the 'reports' section of the 'Analyses' chapter of docs.openema.org it is indicated that approx. 9.6 million unique reports are presented by EMA to Healthcare Professionals and the Public. In the 2022 Annual Report on EudraVigilance for the European Parliament, the Council and the Commission, however it is said there are some 15 million cases.
No conclusions can be drawn based on the subset of information that is the 9.6 million unique reports.
You can download CSV files and PostgreSQL database dumps from:
- All available downloads
- CSV files and postgreSQL dump created on Jun 20, 2023
- CSV files created on Sep 15, 2023
You may visit the European Medicines Agency website here
You may query the EudraVigilance system here
